Documentation Index
Fetch the complete documentation index at: https://docs.vessl.ai/llms.txt
Use this file to discover all available pages before exploring further.
Executions dashboard
The executions dashboard helps you manage the status of your executions, including running, aborted, failed, completed, and more.Executions tab, you can see the list of executions, including the following information:
- Execution numbers and status of each execution
- Person (or triggered reason) who triggered the execution
- Duration
- Timeline (Started, Finished) that shows the time when you run execution and finish.
- Action buttons
- Reproduce: Trigger a pipeline execution with the same variables.
- Abort: Stop the running execution.
Filter
You can apply the filter by status or assignee to easily find the execution you want.Filterable items list
Filterable items list
- Status filter
- Running
- Aborting
- Failed
- Completed
- Aborted
- Action required
- Idle
- Assignee filter — Filter by the assignee whom you designated in a manual input step.
How to run a pipeline execution
Once you have published a pipeline revision, you can run execution using the button on the revisions tab. The new execution will always be created with the latest revision of the pipeline.Executions tab. Refer to the demo below and explore its functions.
Execution details
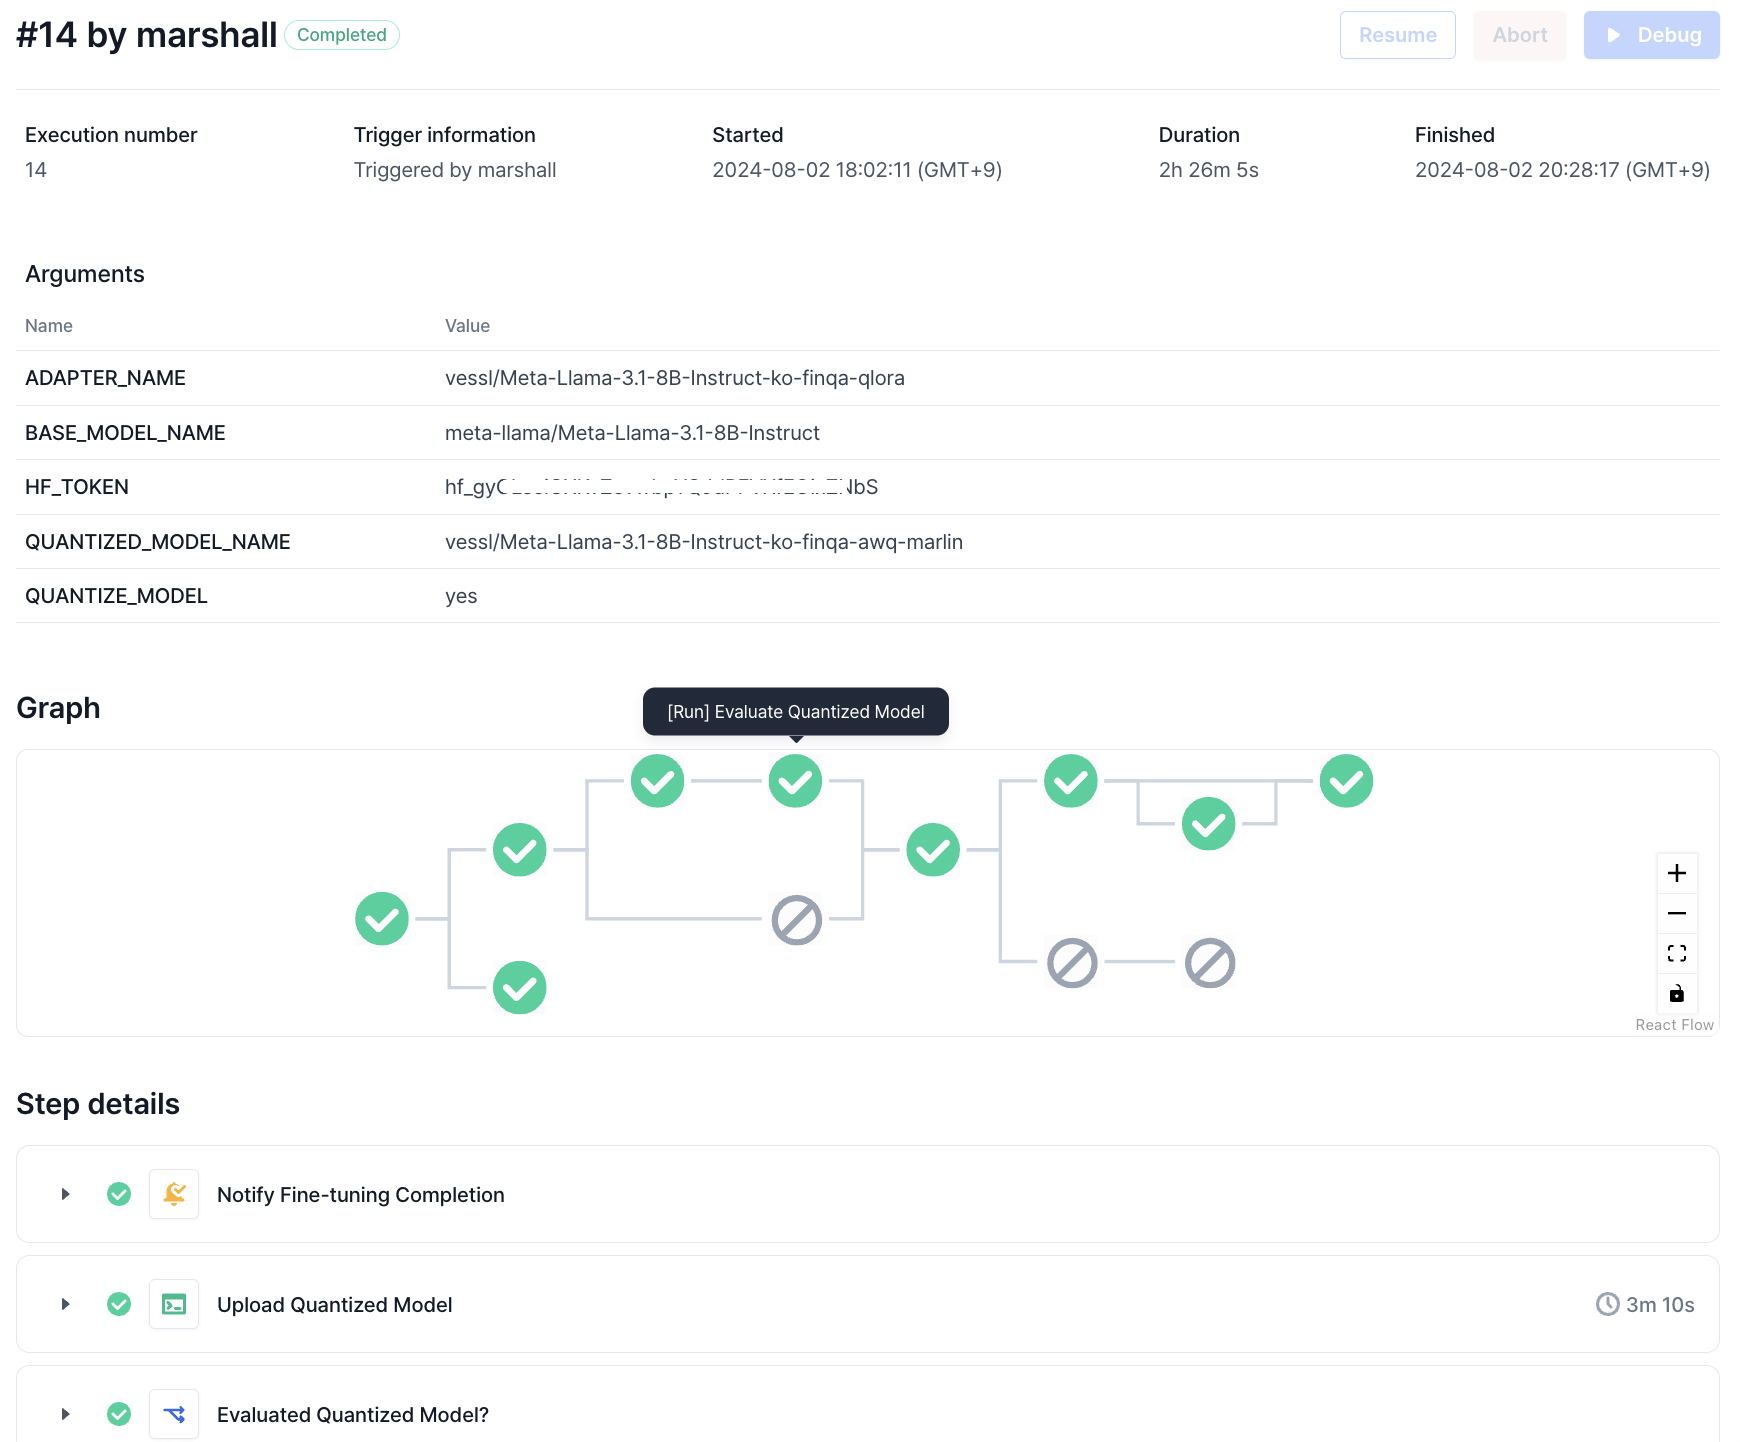
When you click on the execution from the execution list table, you can navigate to the execution detail page.
- Metadata: Metadata of the execution including ID, status, duration, and triggered time.
- Pipeline variables: Variables injected during a pipeline execution.
- Graph: Visualized graph view of the execution.
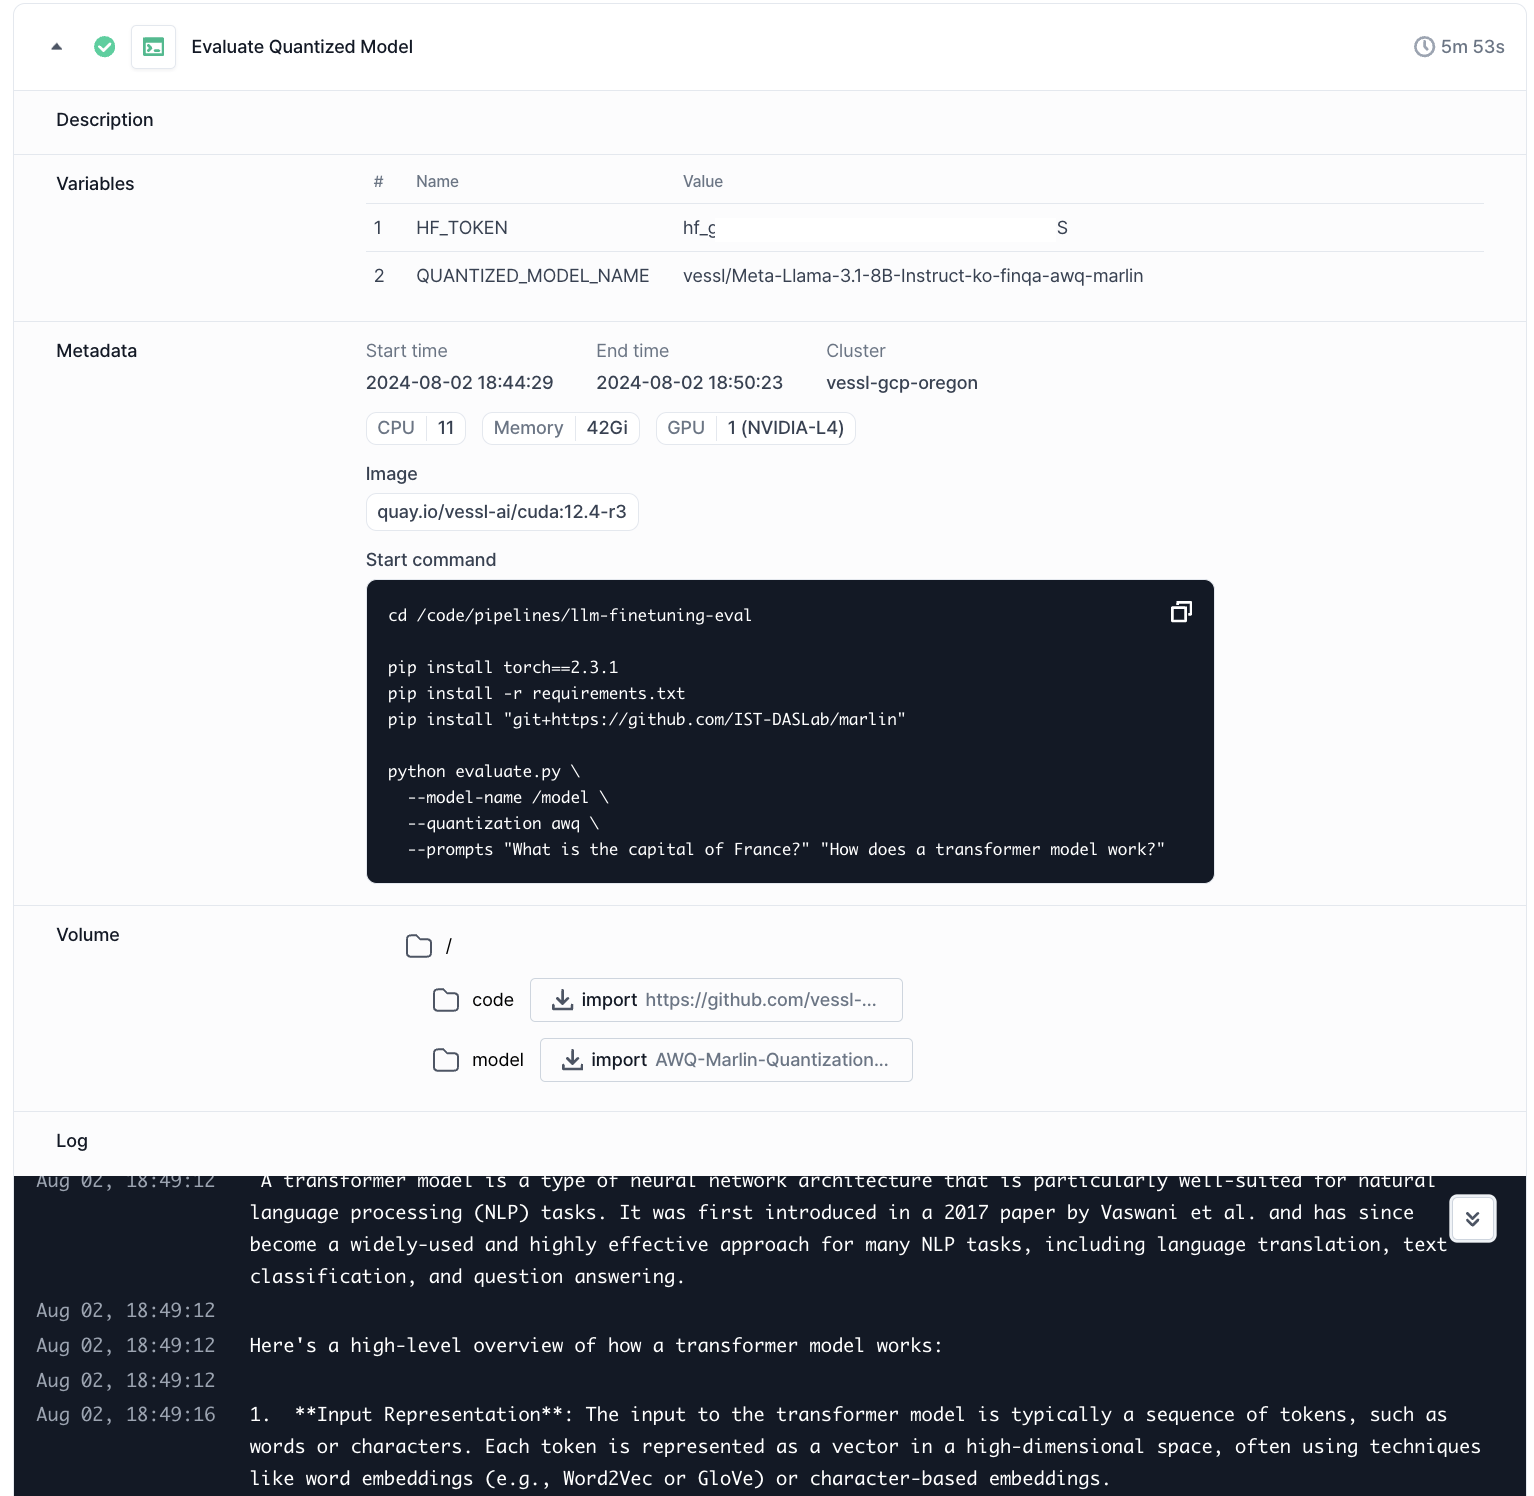
- Step details: Detailed list of steps ran during the execution.

Debug mode
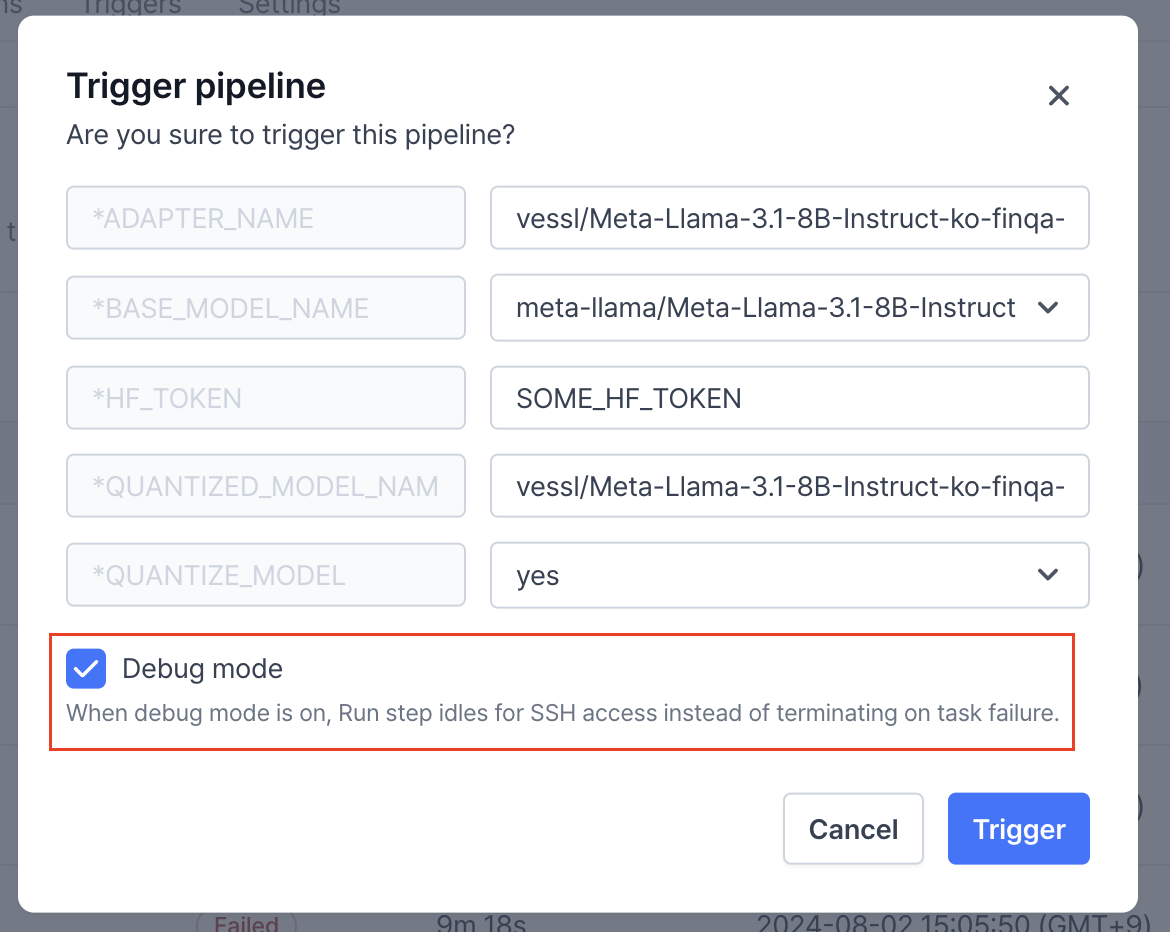
Debugging complicated workflow is always challenging. To help you debug a pipeline execution, you can enable the debug mode when you trigger the pipeline execution.
idle status on the execution list and actions enabled on the detail page. You can also see the logs that the container opened SSH access for debugging.


- Resume: Mark the step as successful and continue the execution.
- Abort: Stop the running execution.
- Debug: Connect to the container through SSH.

