Experiment Summary
Under SUMMARY, you can view all the experiment configurations such as environment variables, quick reproduce via CLI, Docker image, and resource specification.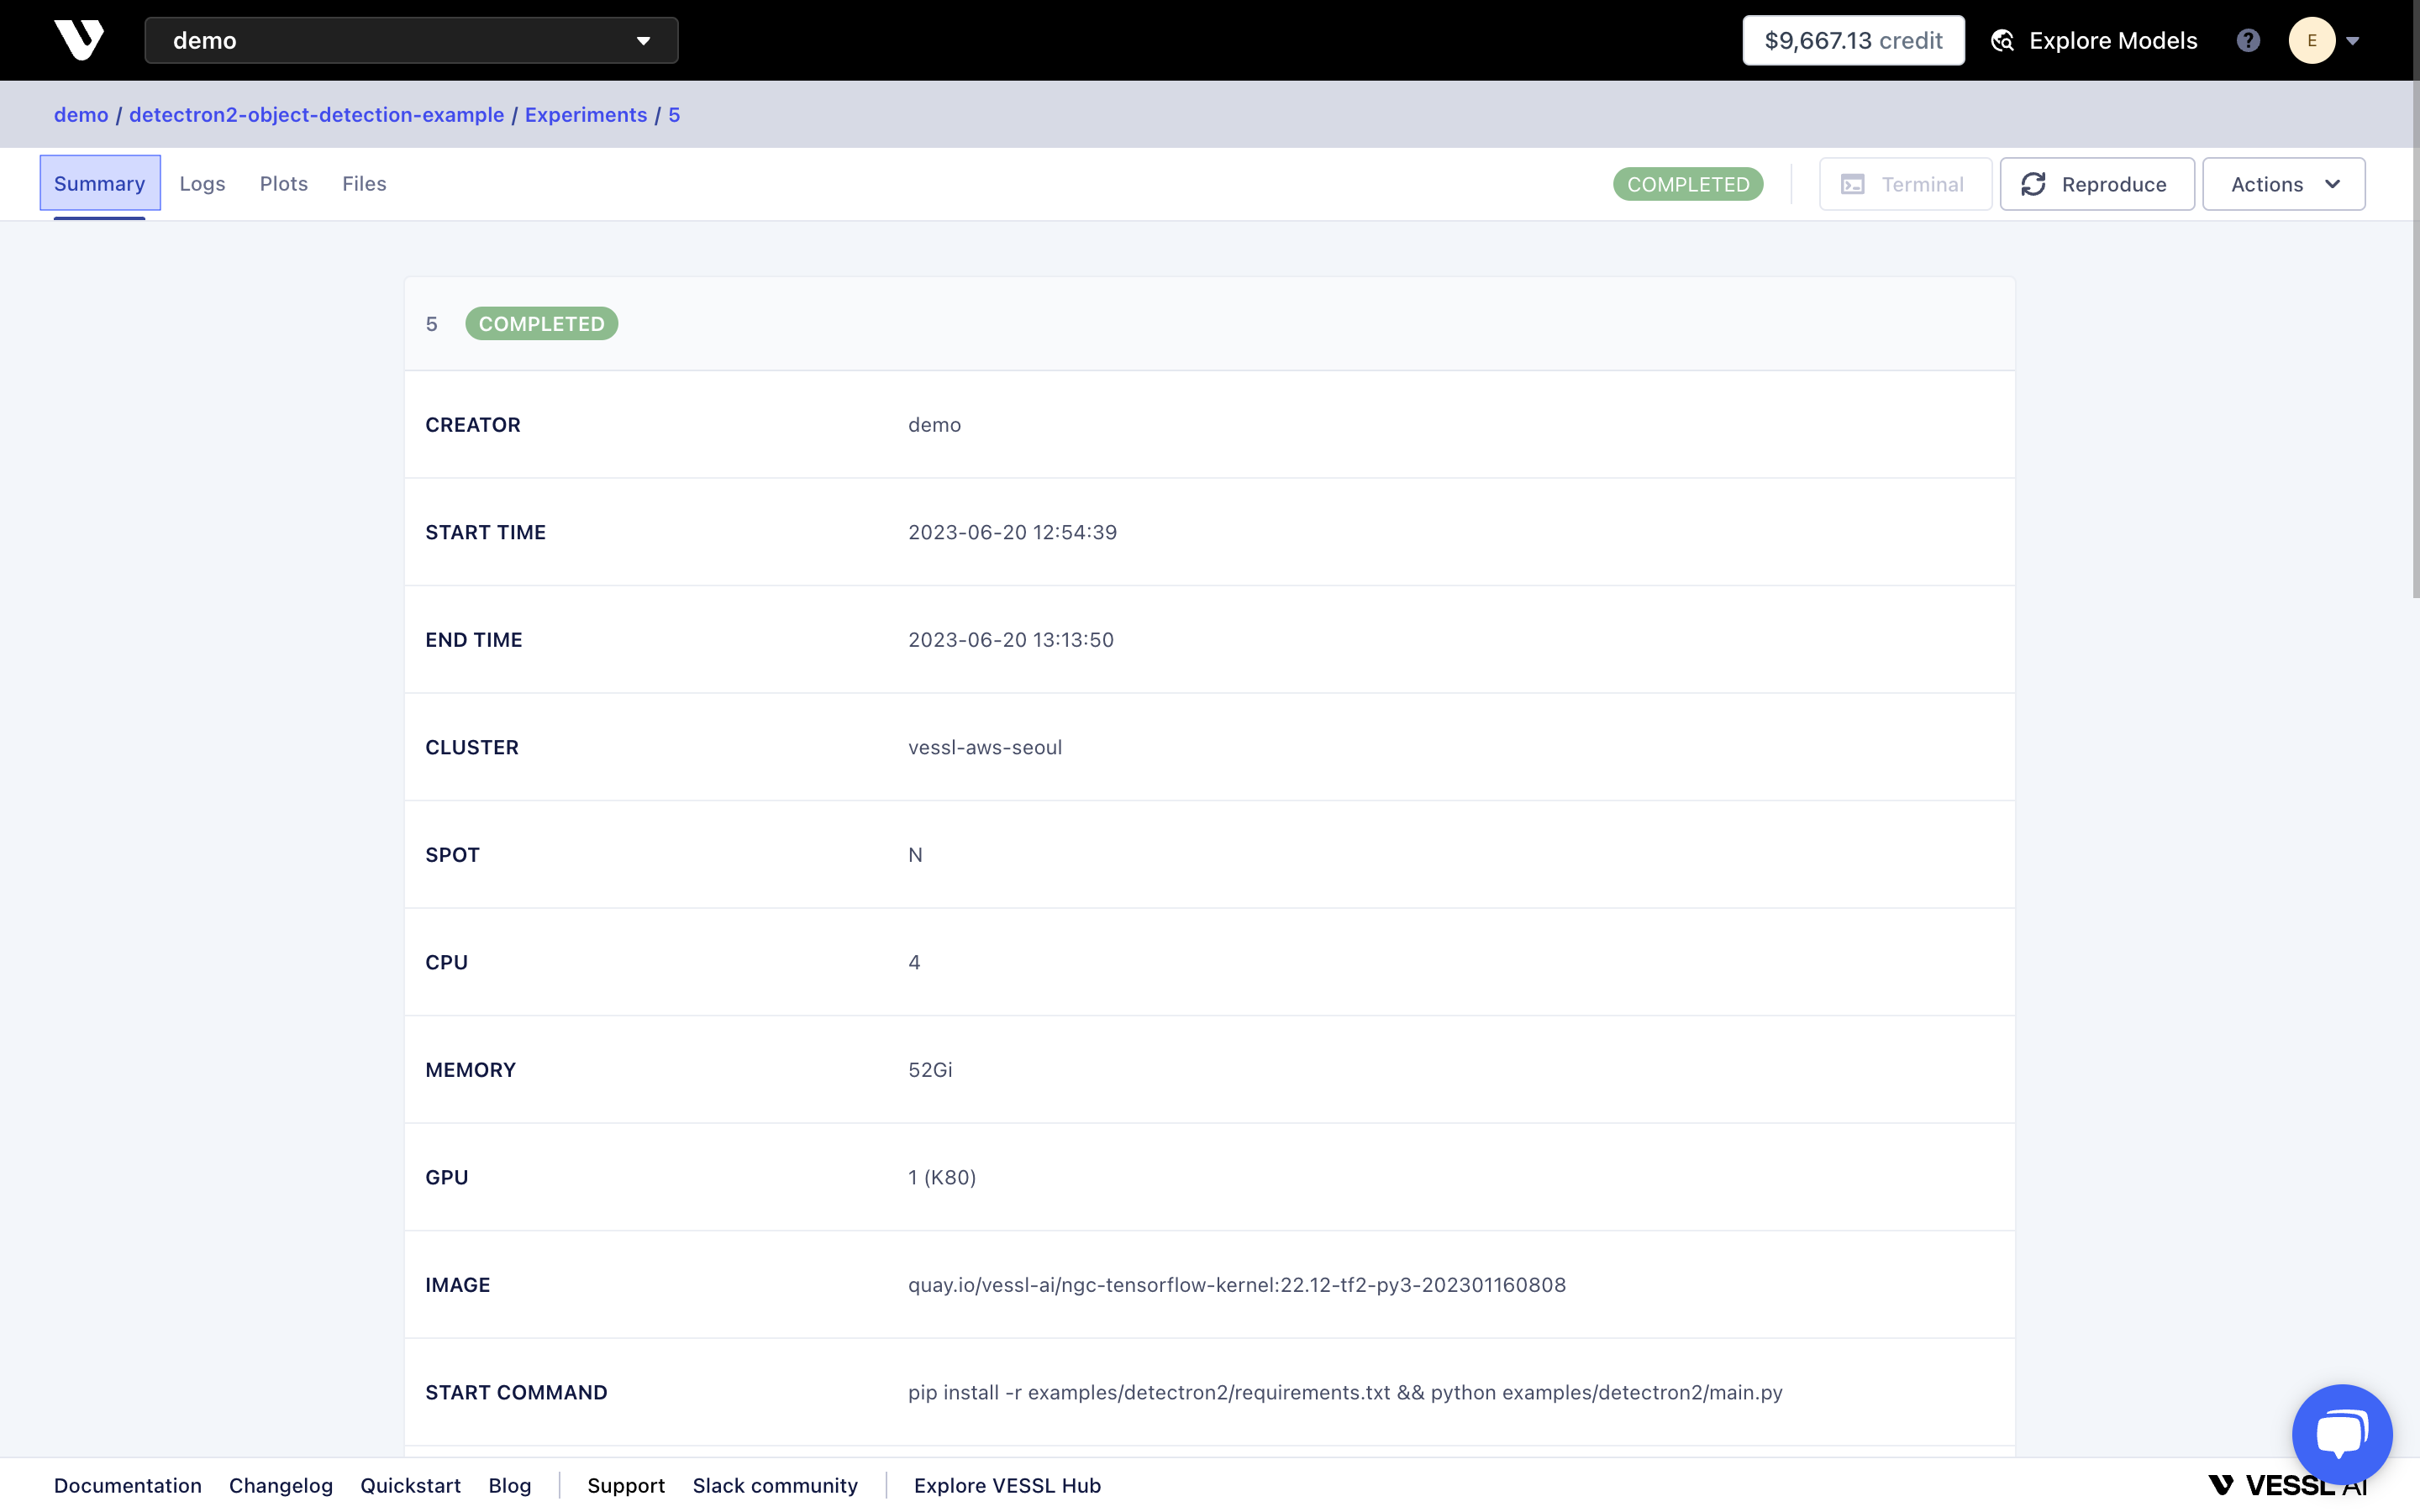
Logs
Under LOGS, you can monitor the logs from the experiment Docker container including status updates andprint() statements.

Plots
You need to use VESSL’s Python SDK to view metrics or multimedia files.

Multimedia
You can also view images. You can configure the number of displayed images using VESSL’s Python SDK.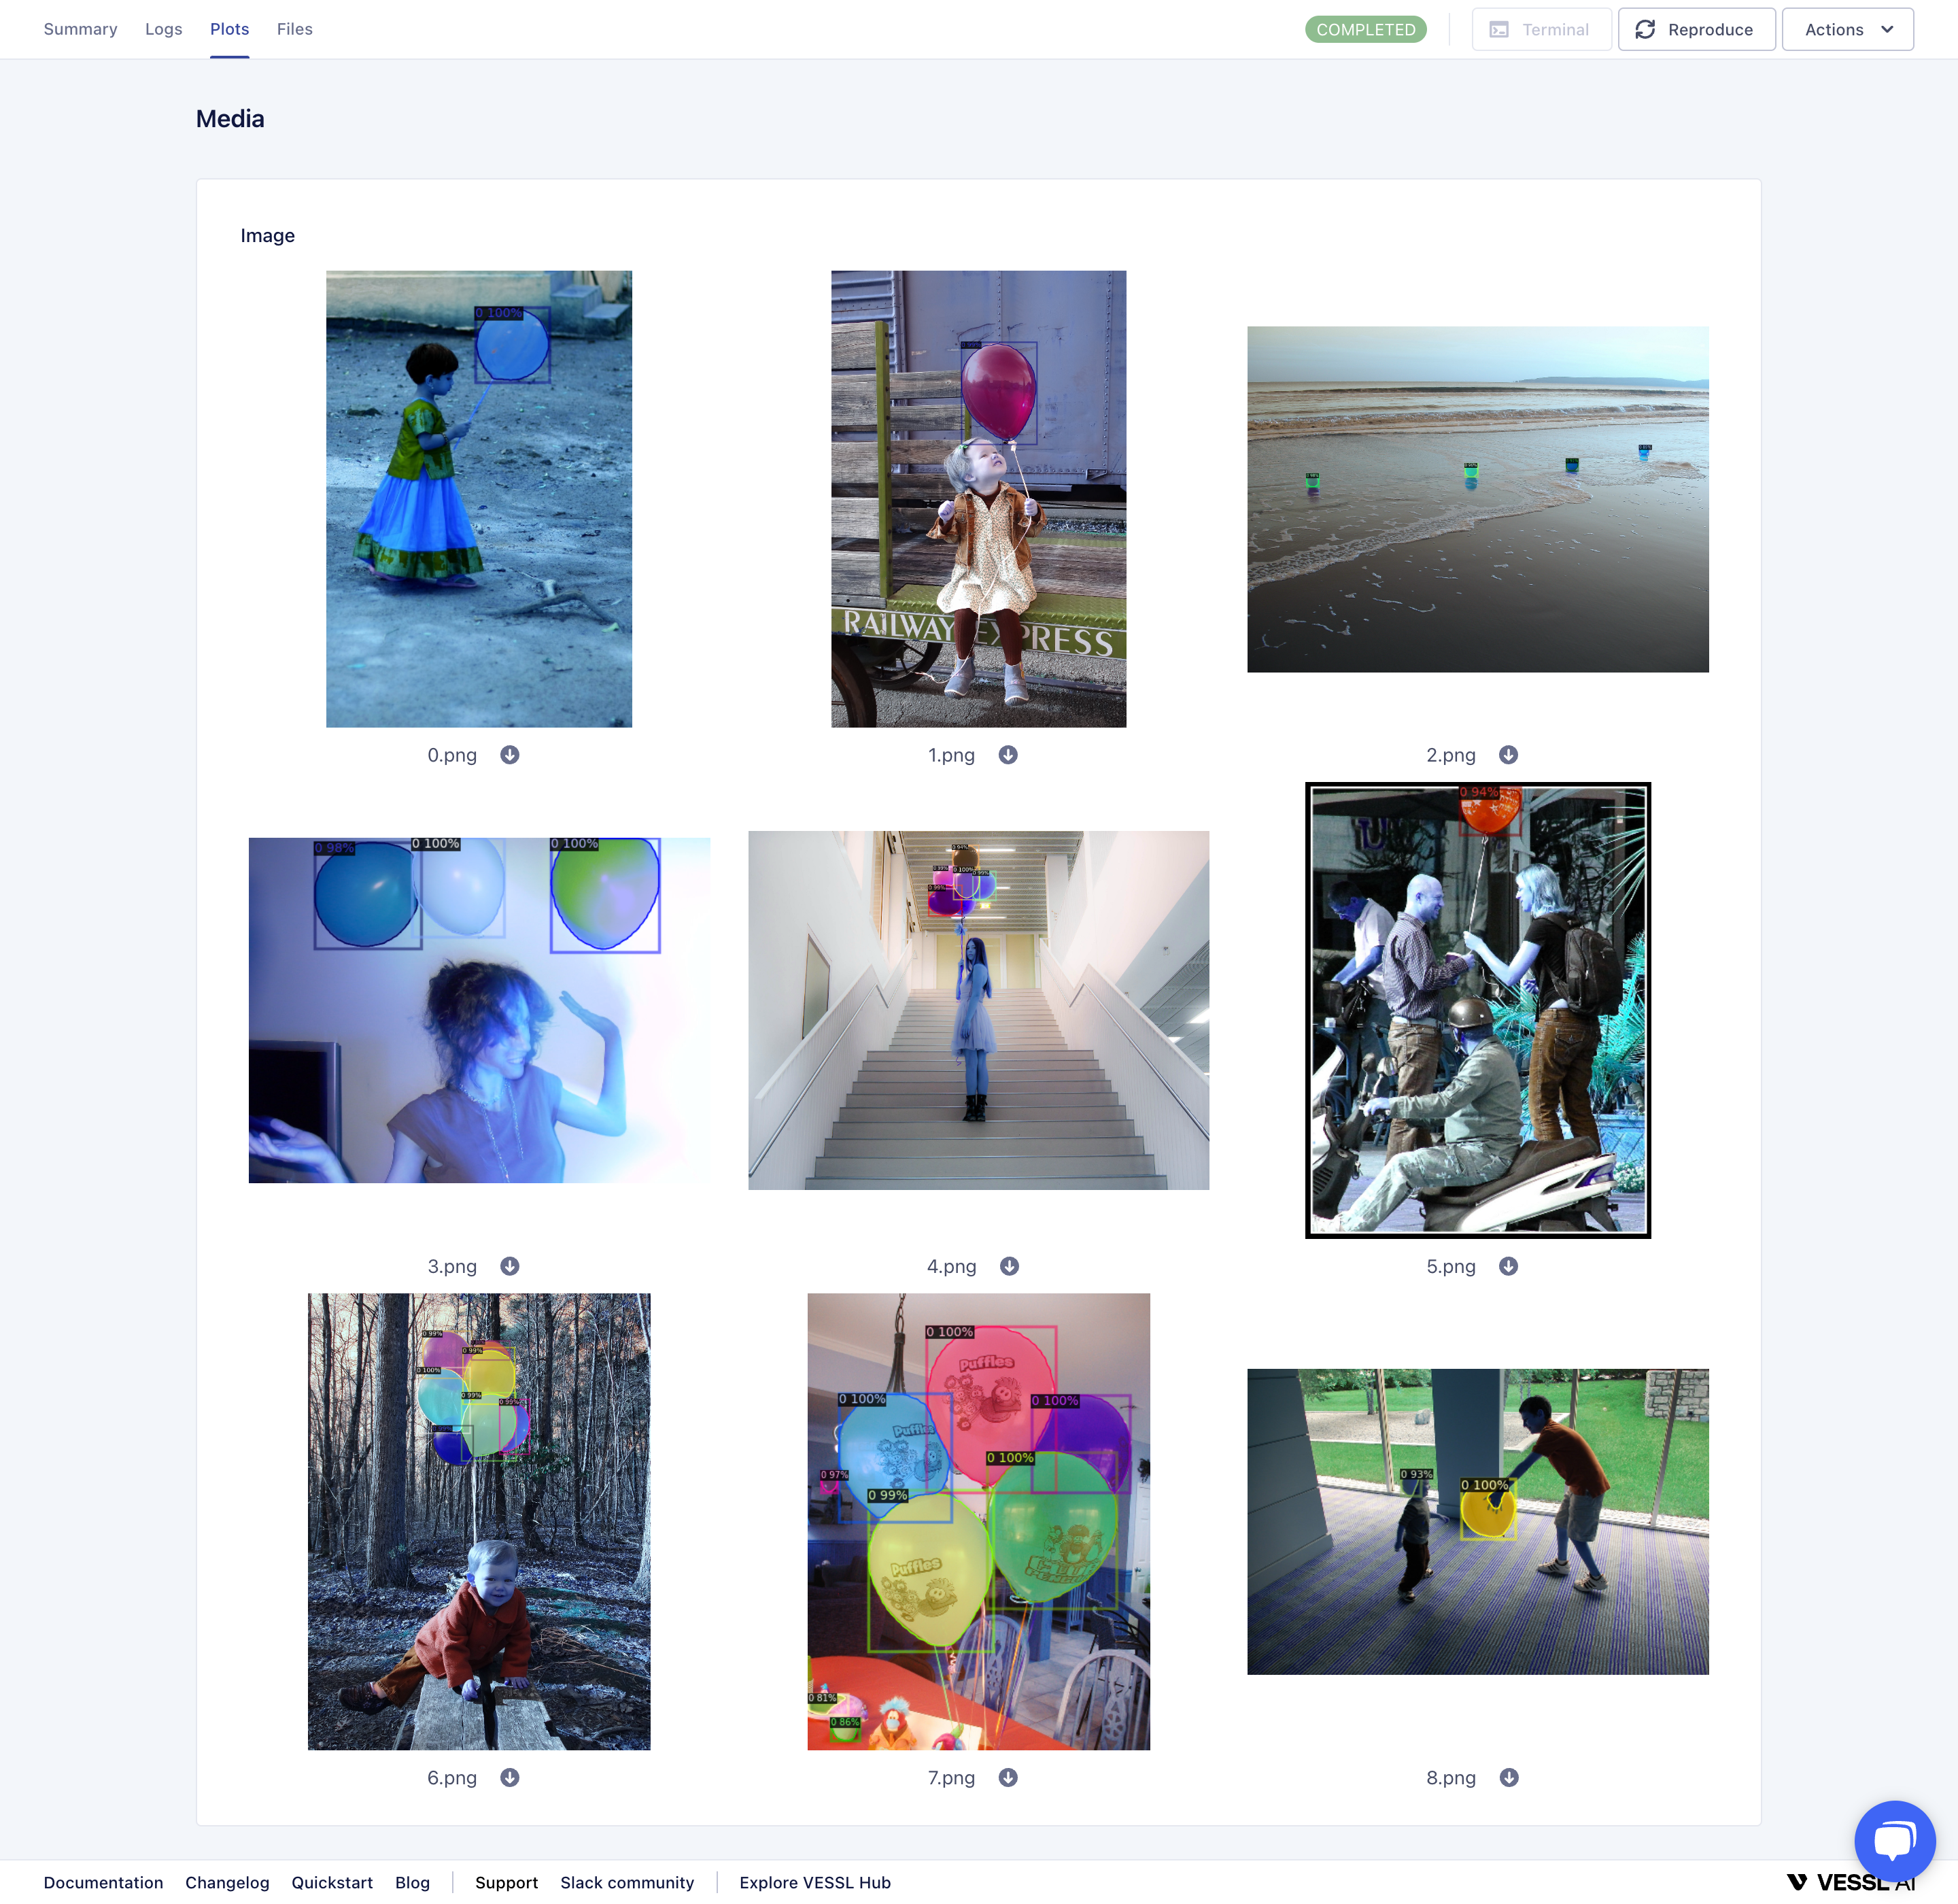
System Metrics
You can monitor system metrics such as CPU, GPU, memory, disk, and network usage.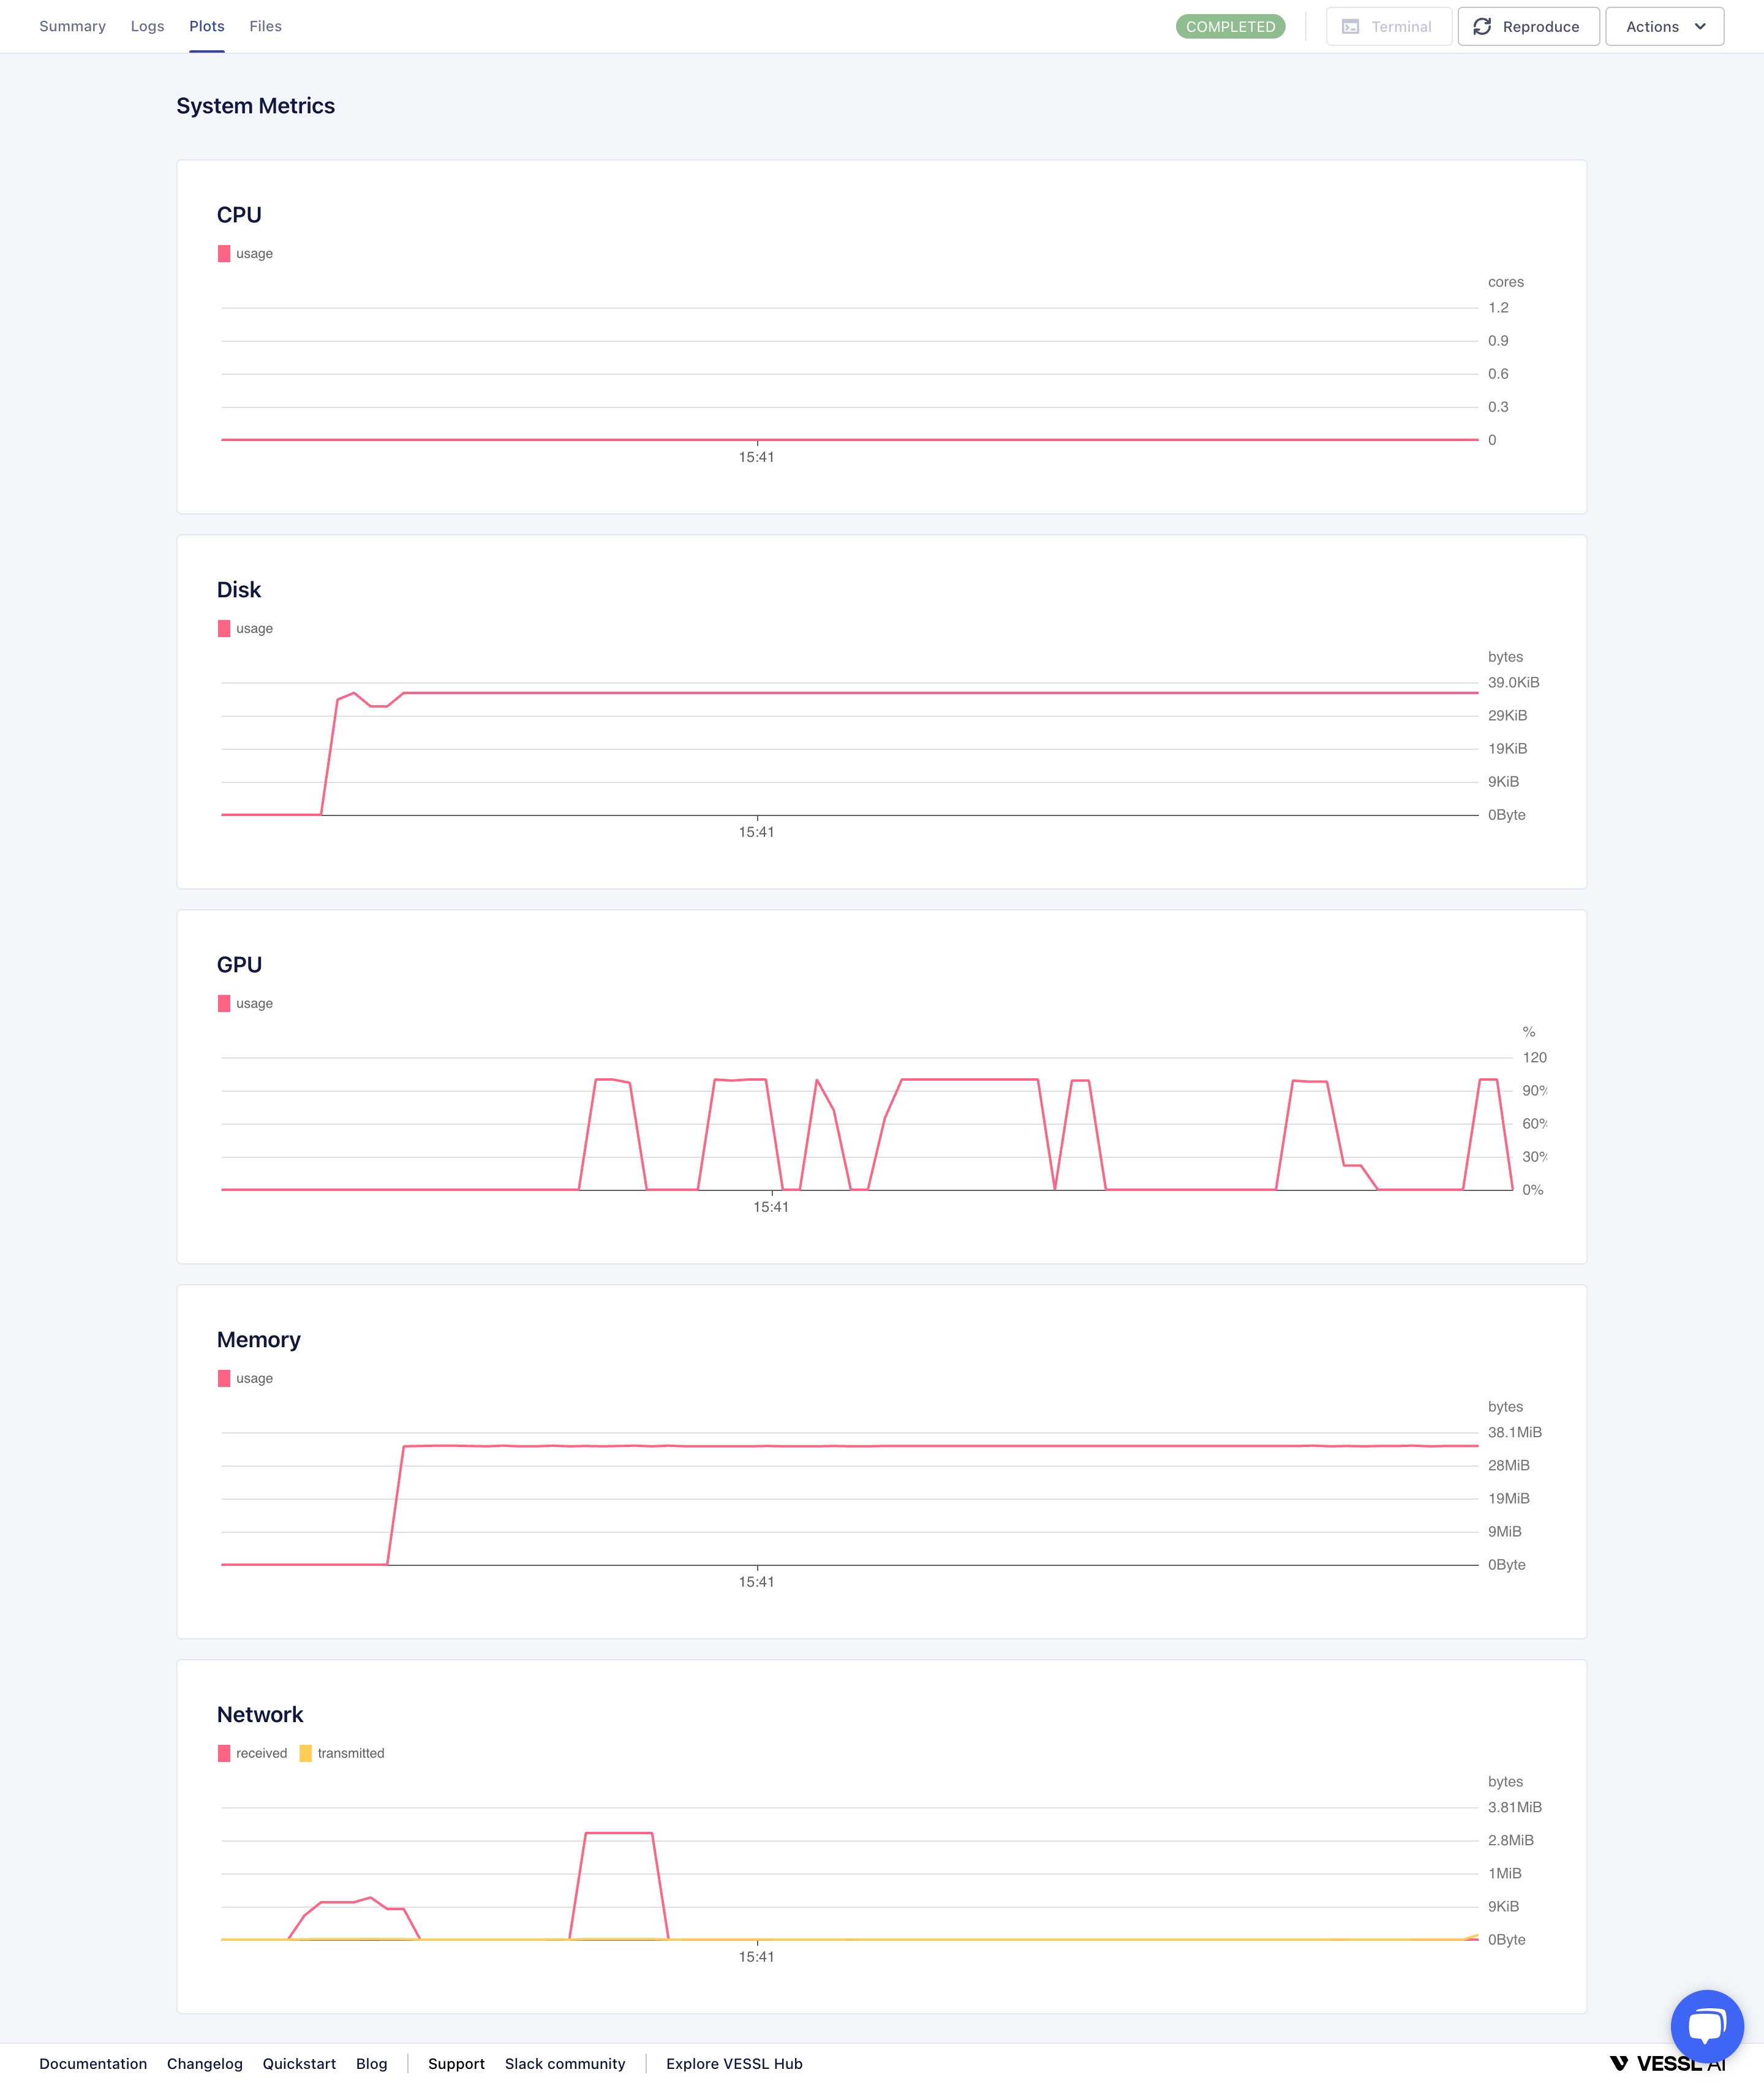
Files
Under FILES, you can navigate and download the output and input files. You can also do this using VESSL Client CLI.