Monitoring
Under MONITORING, you can monitor your Sweeps on a rich dashboard.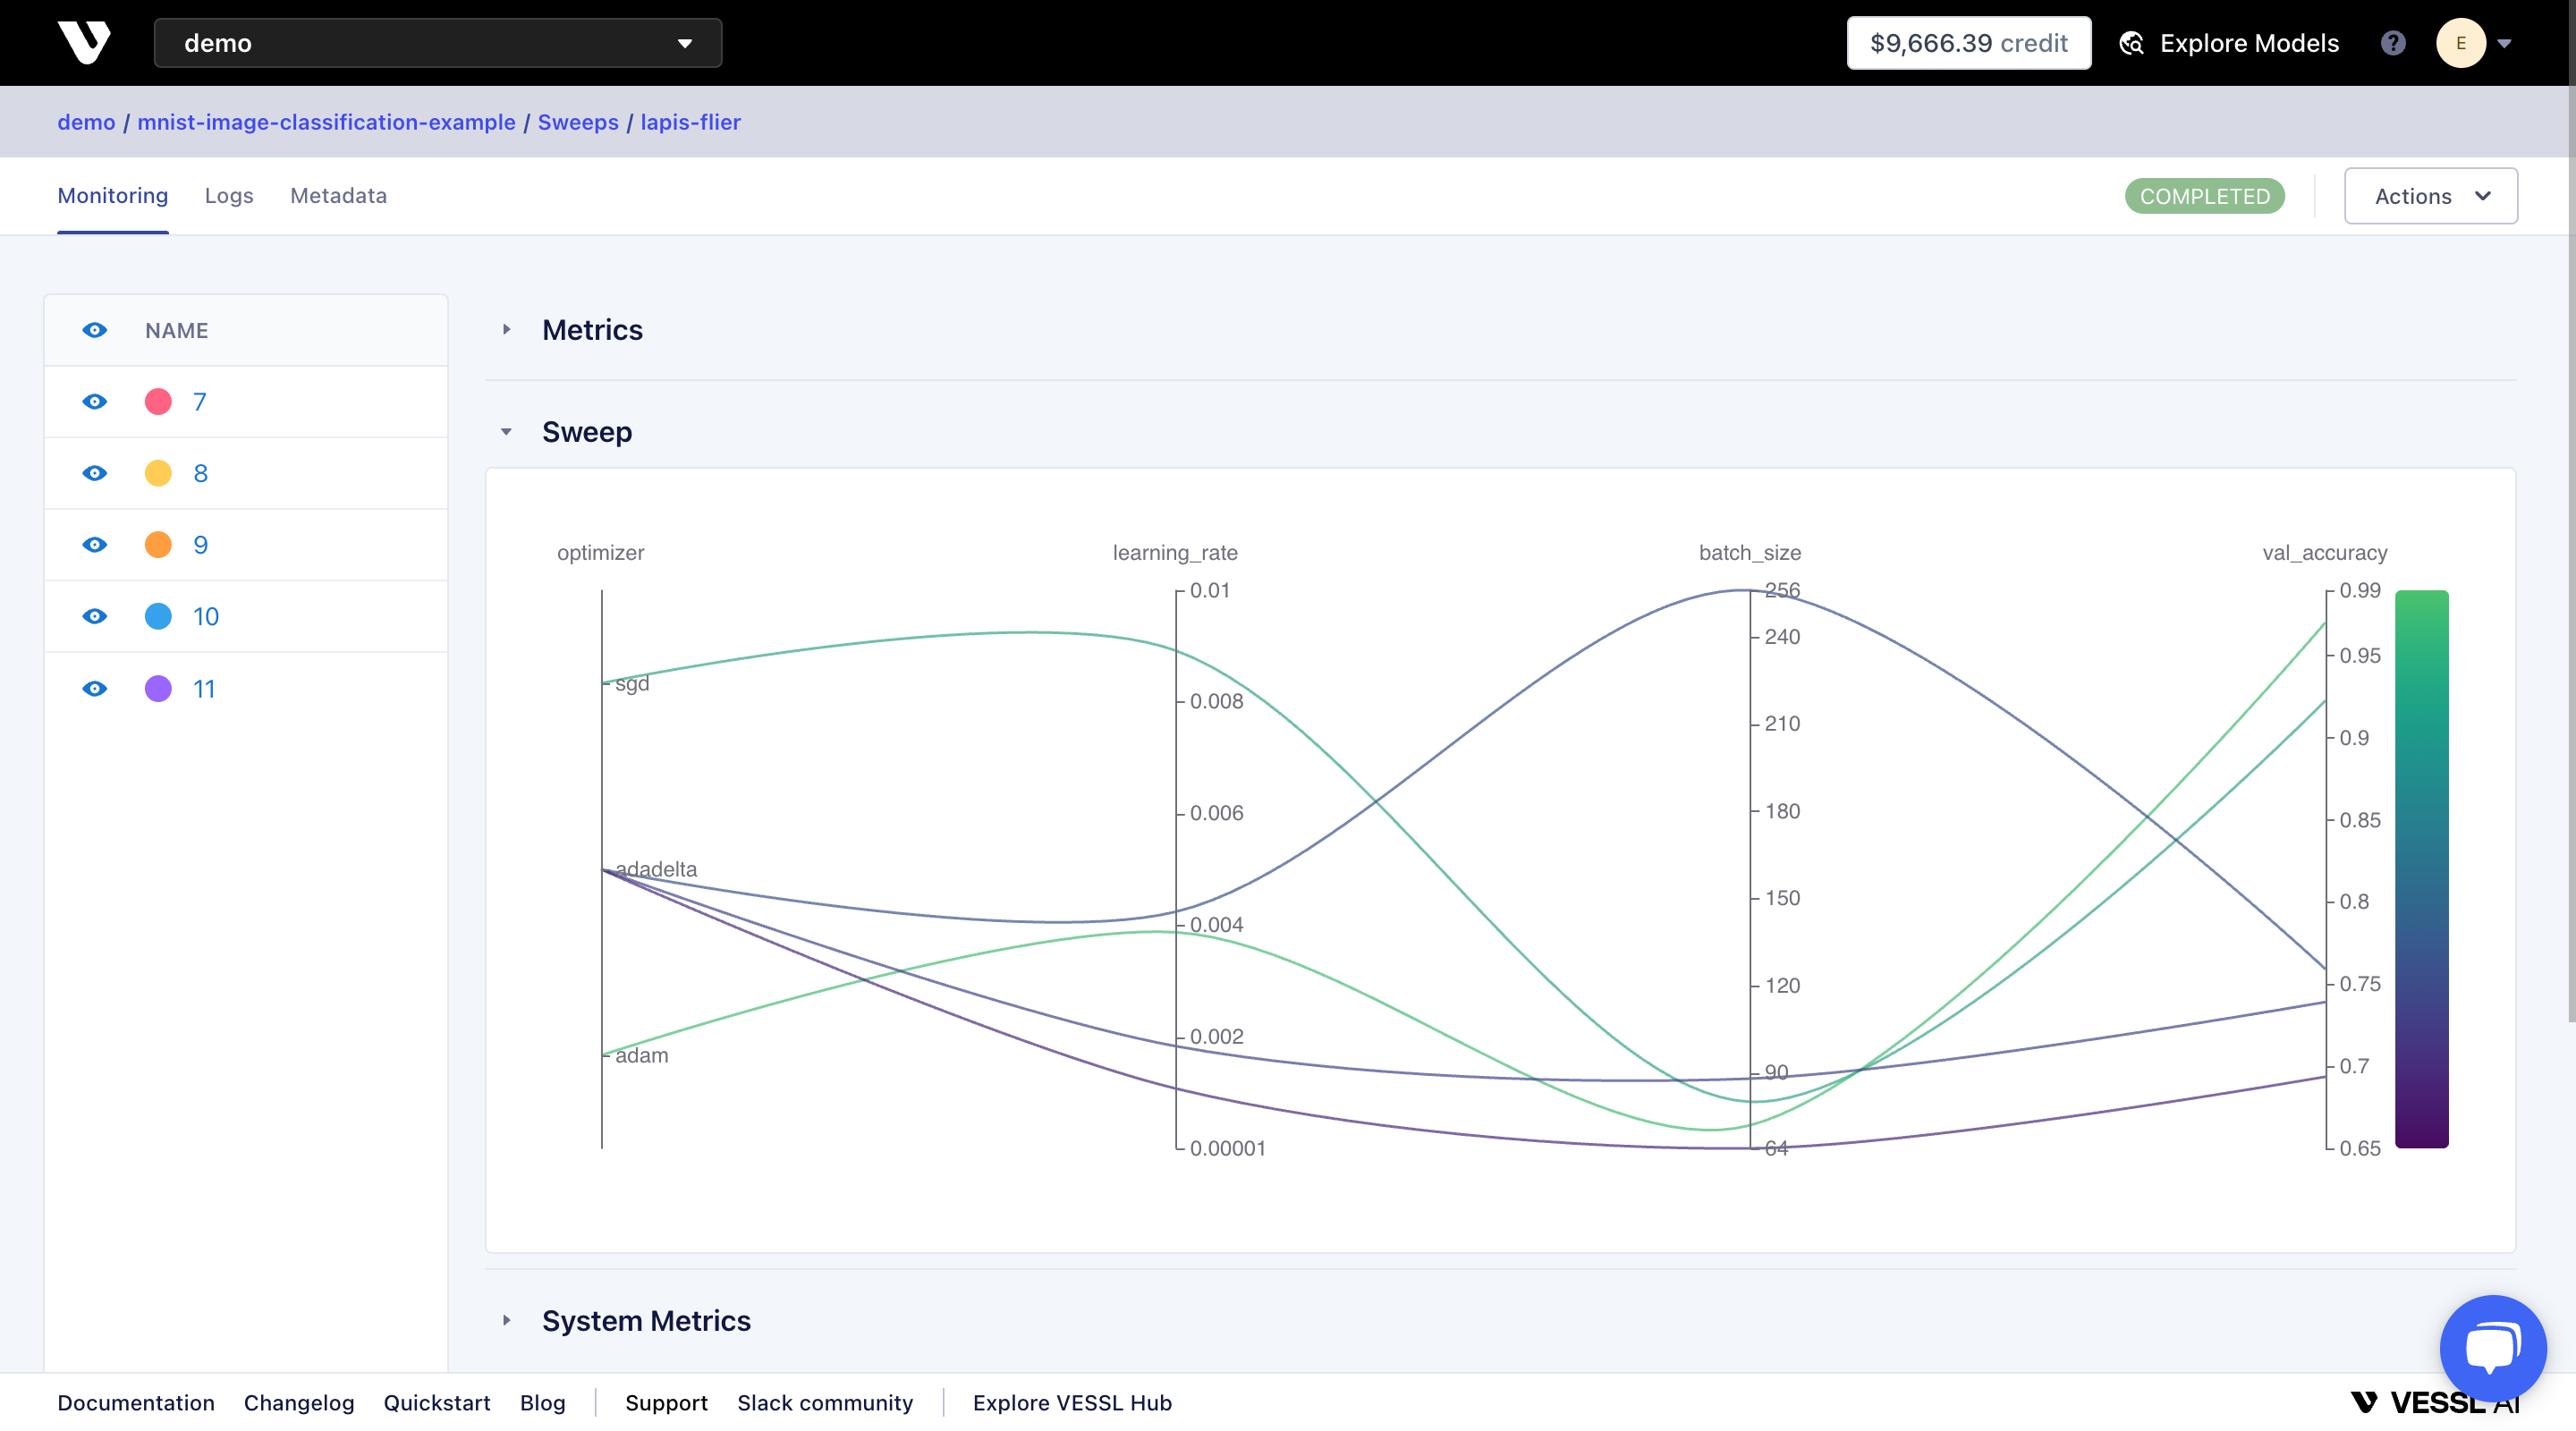
Metrics
Under Metrics, you can see the metrics that you have logged to the VESSL server usingvessl.log() or VesslCallback() in VESSL SDK. Each experiment is colored differently. You can hide experiments from the plot by toggling the view button.
Sweep
Under Sweep, you can see the visualization of multiple experiments. Each curve represents an experiment and you can view the details of the experiment by hovering on the curve.System Metrics
Under System Metrics, you can monitor the resource consumption of each experiment. If you are using a GPU acceleration, you will be able to monitor GPU utilization as well.Logs
Under LOGS tab, you can find logging records with experiment status and metrics.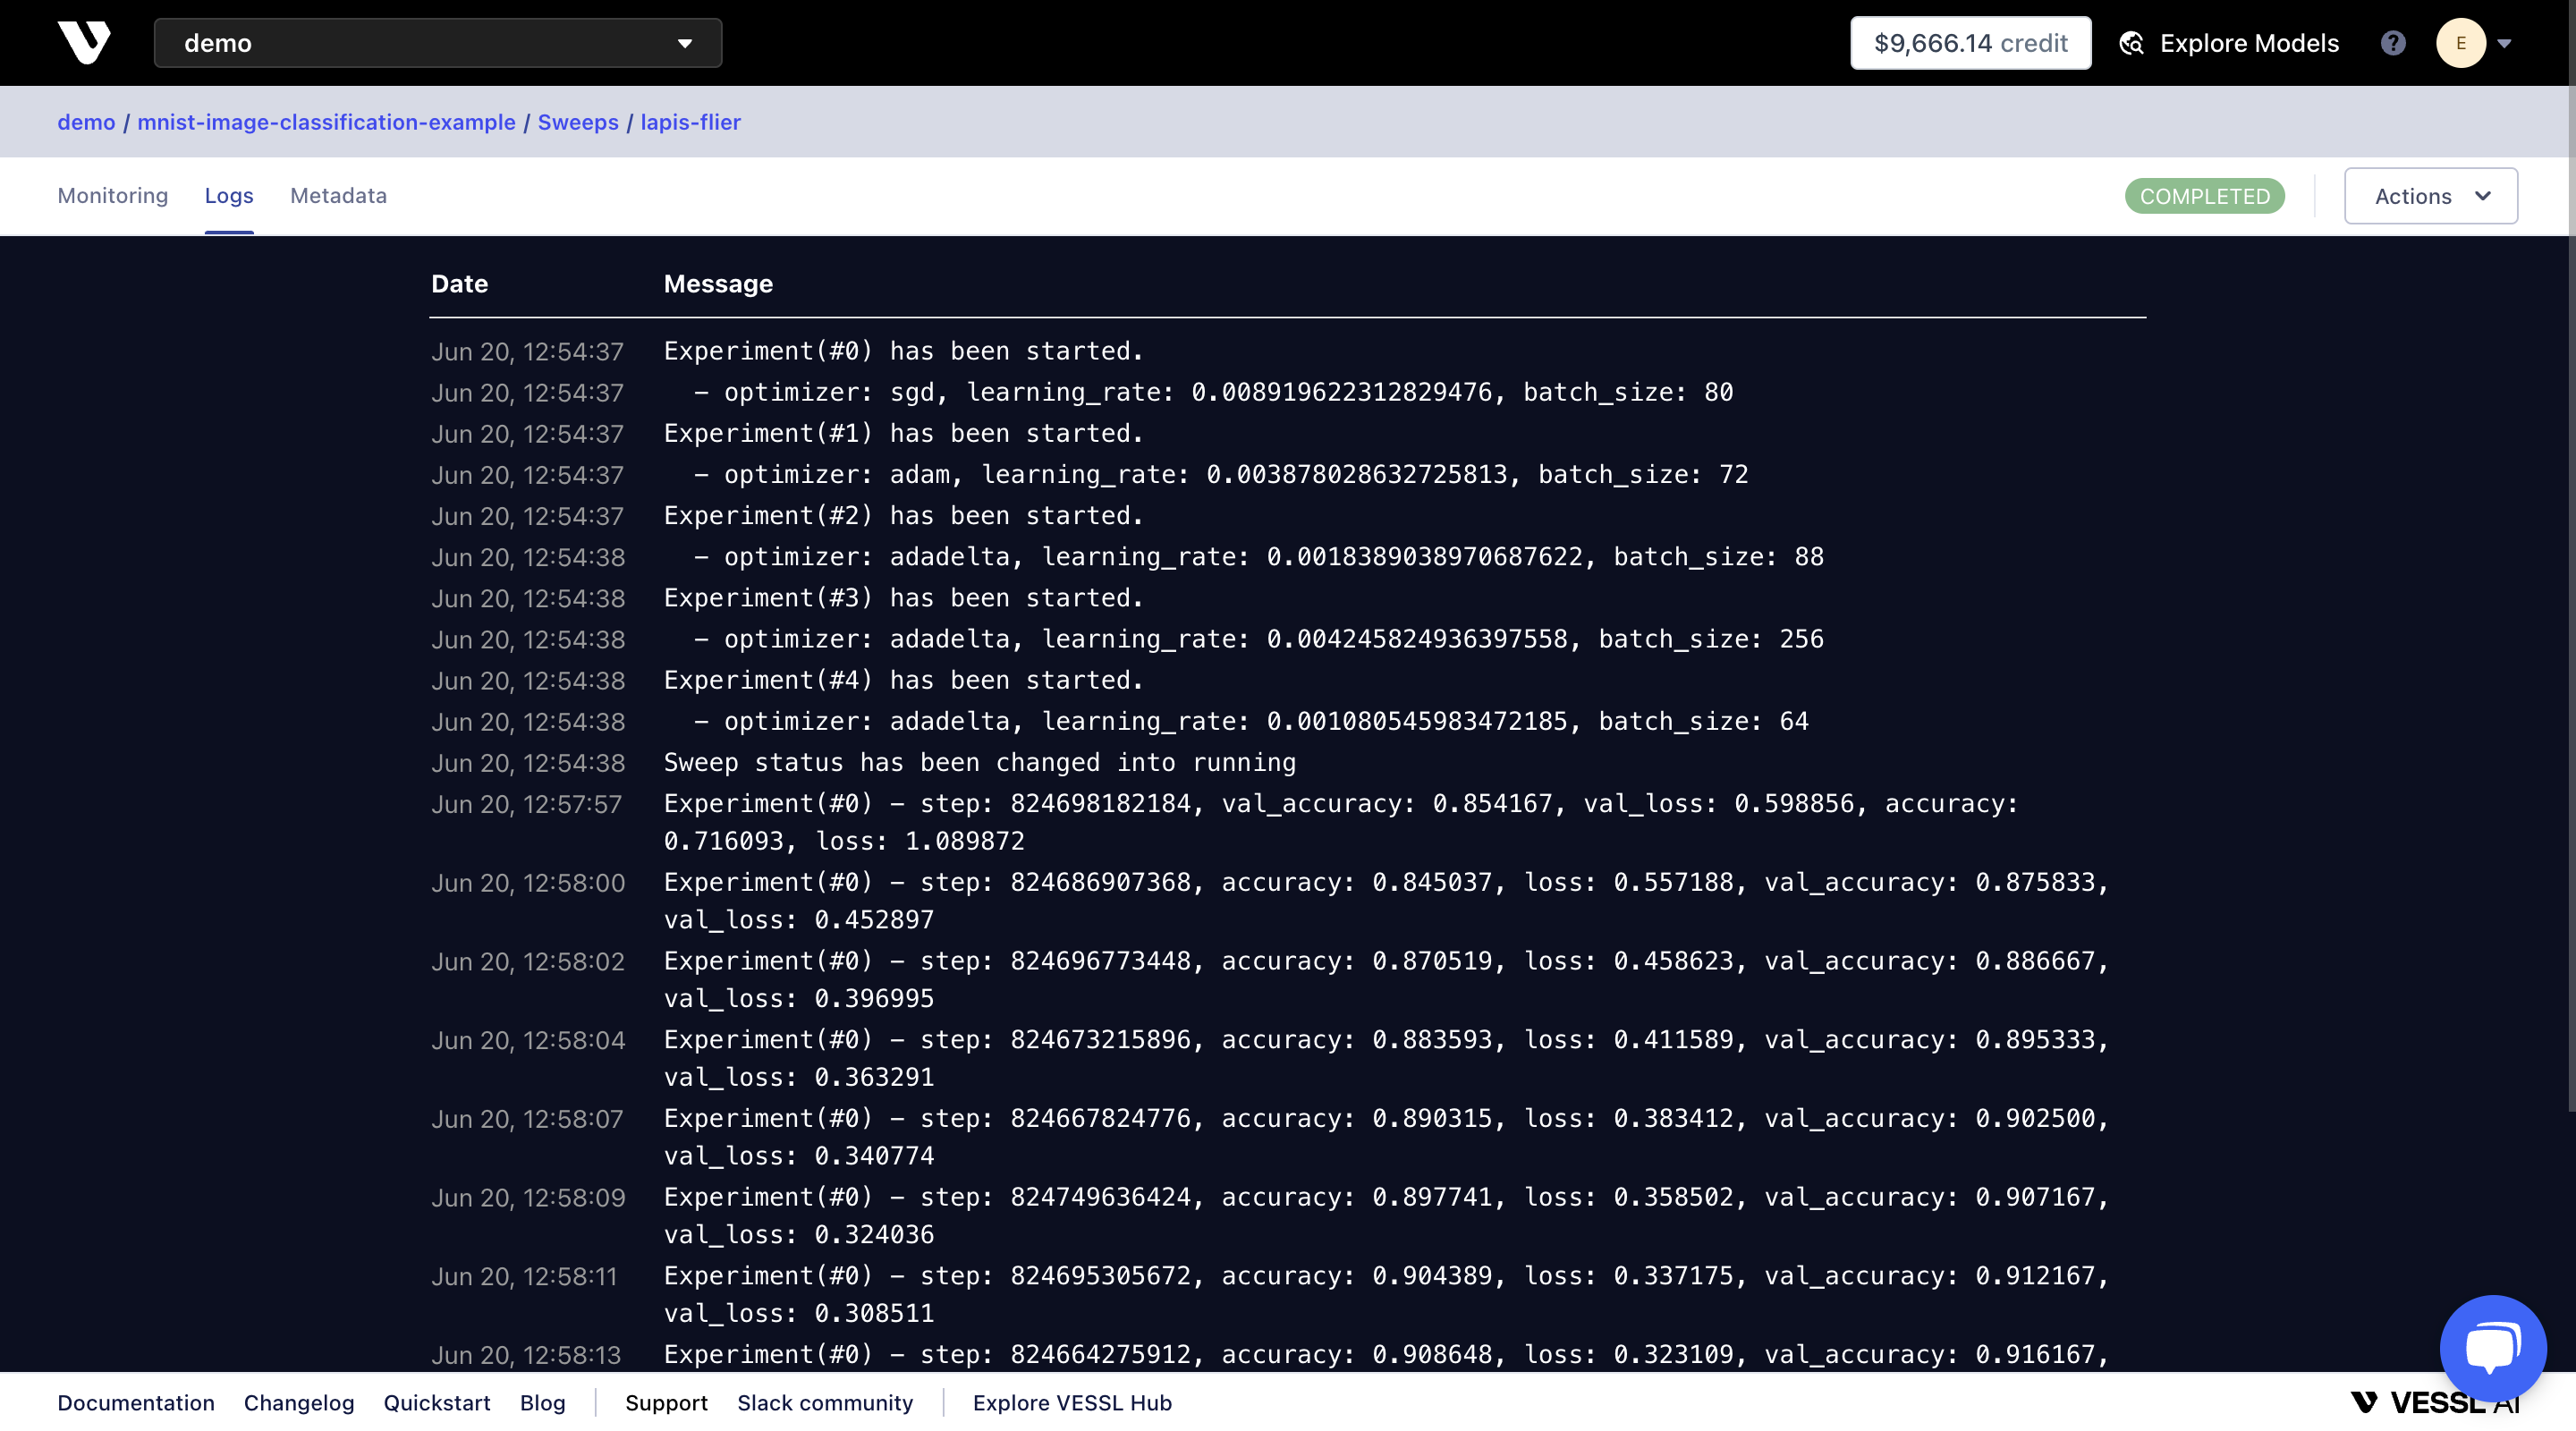
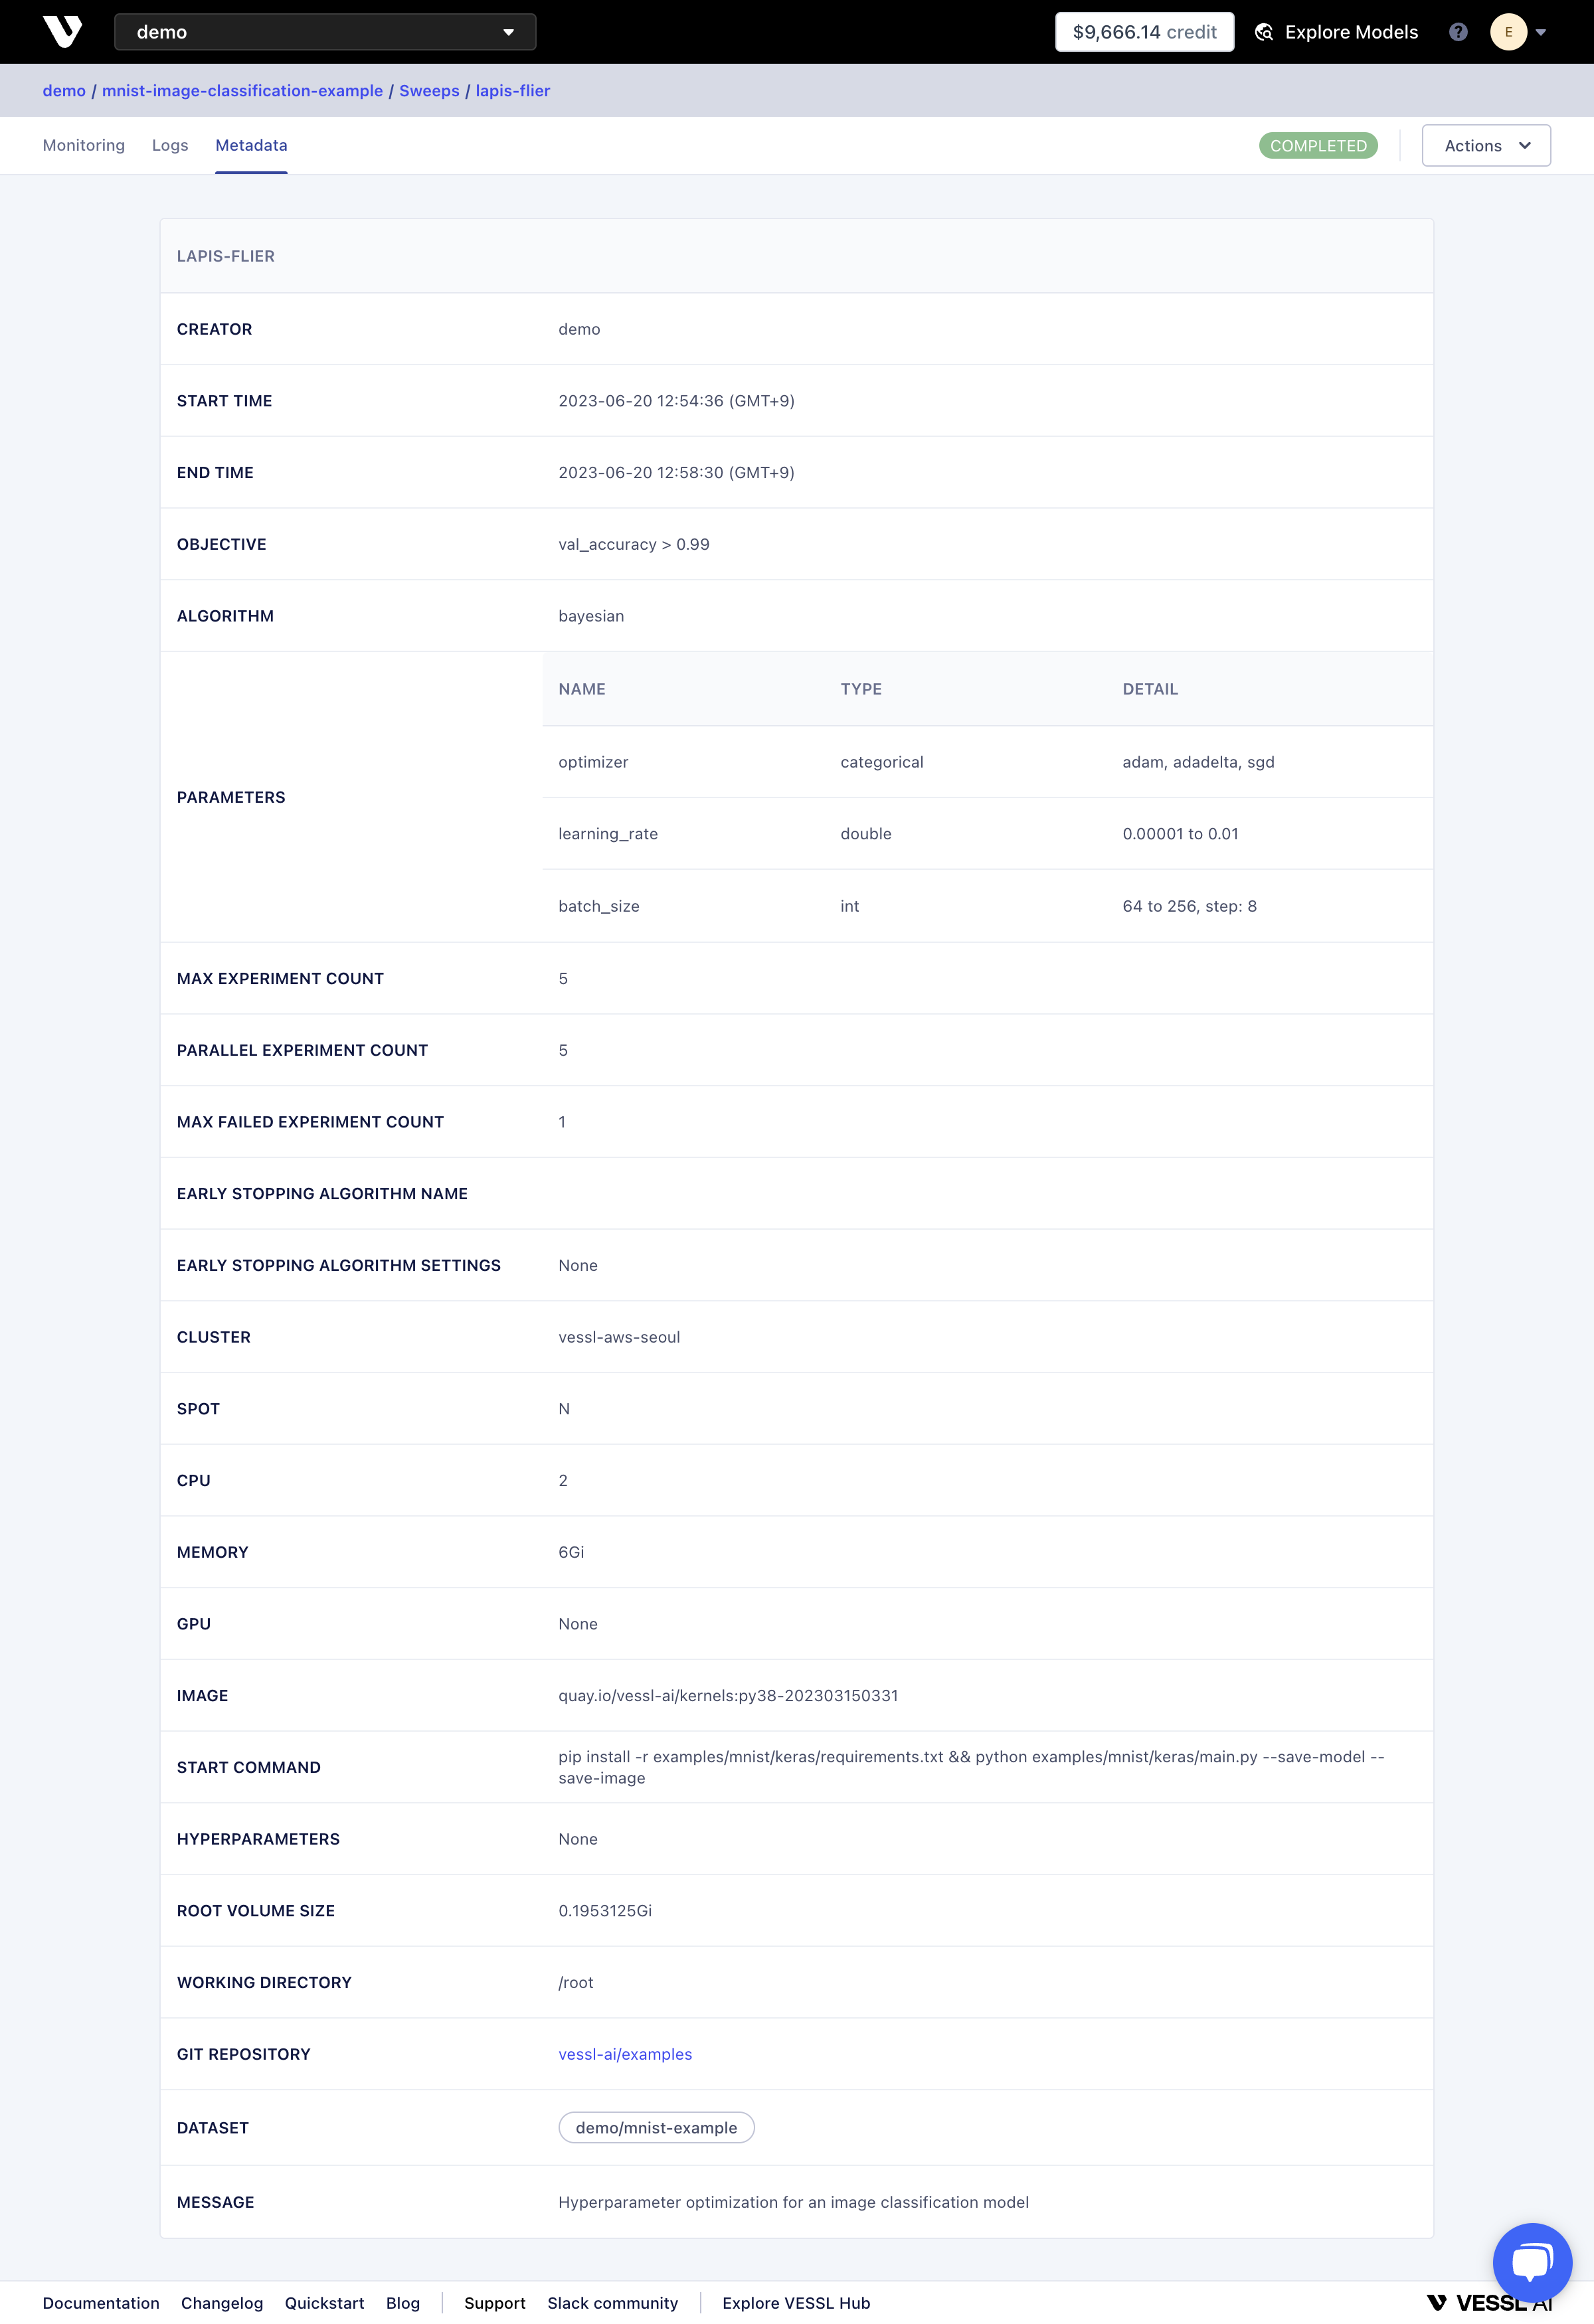
Metadata
Under METADATA, you can find the configuration for the current Sweep and runtime.