> ## Documentation Index
> Fetch the complete documentation index at: https://docs.vessl.ai/llms.txt
> Use this file to discover all available pages before exploring further.
# Monitor sweeps
### Monitoring
Under **MONITORING**, you can monitor your Sweeps on a rich dashboard.
 #### Metrics
Under **Metrics**, you can see the metrics that you have logged to the VESSL server using `vessl.log()` or `VesslCallback()` in VESSL SDK. Each experiment is colored differently. You can hide experiments from the plot by toggling the view button.
#### Sweep
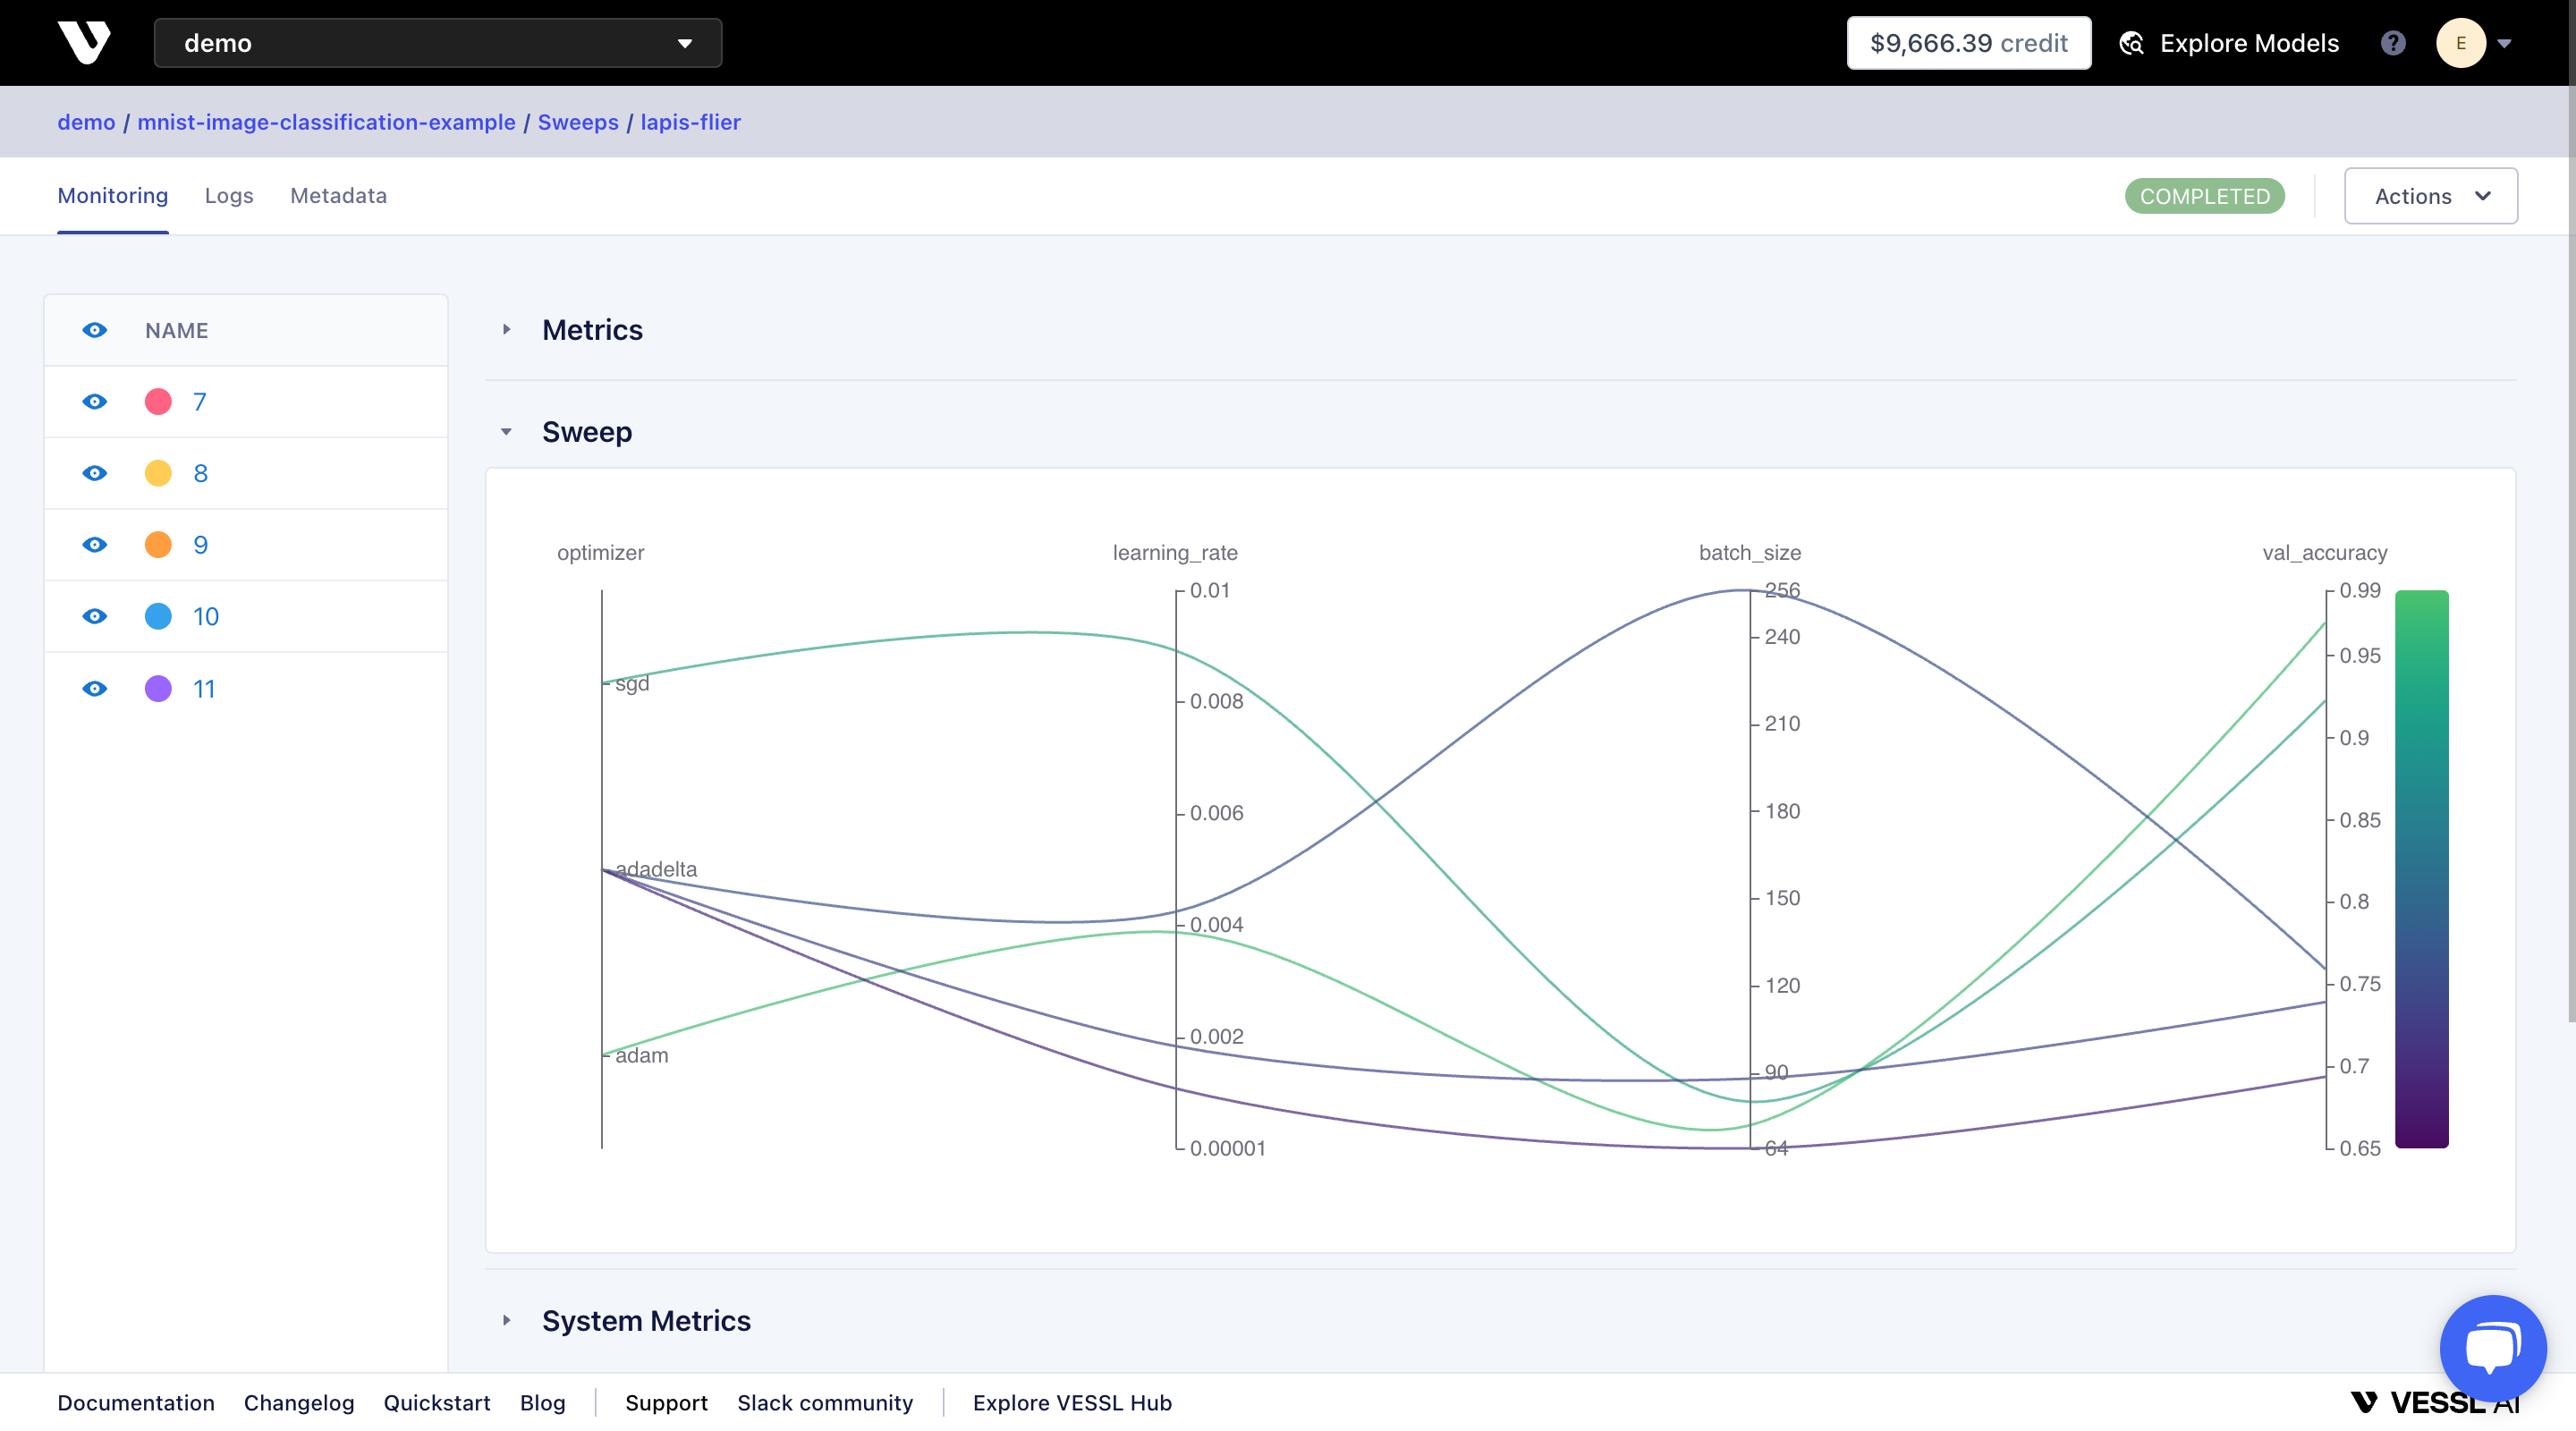
Under **Sweep**, you can see the visualization of multiple experiments. Each curve represents an experiment and you can view the details of the experiment by hovering on the curve.
#### System Metrics
Under **System Metrics**, you can monitor the resource consumption of each experiment. If you are using a GPU acceleration, you will be able to monitor GPU utilization as well.
### Logs
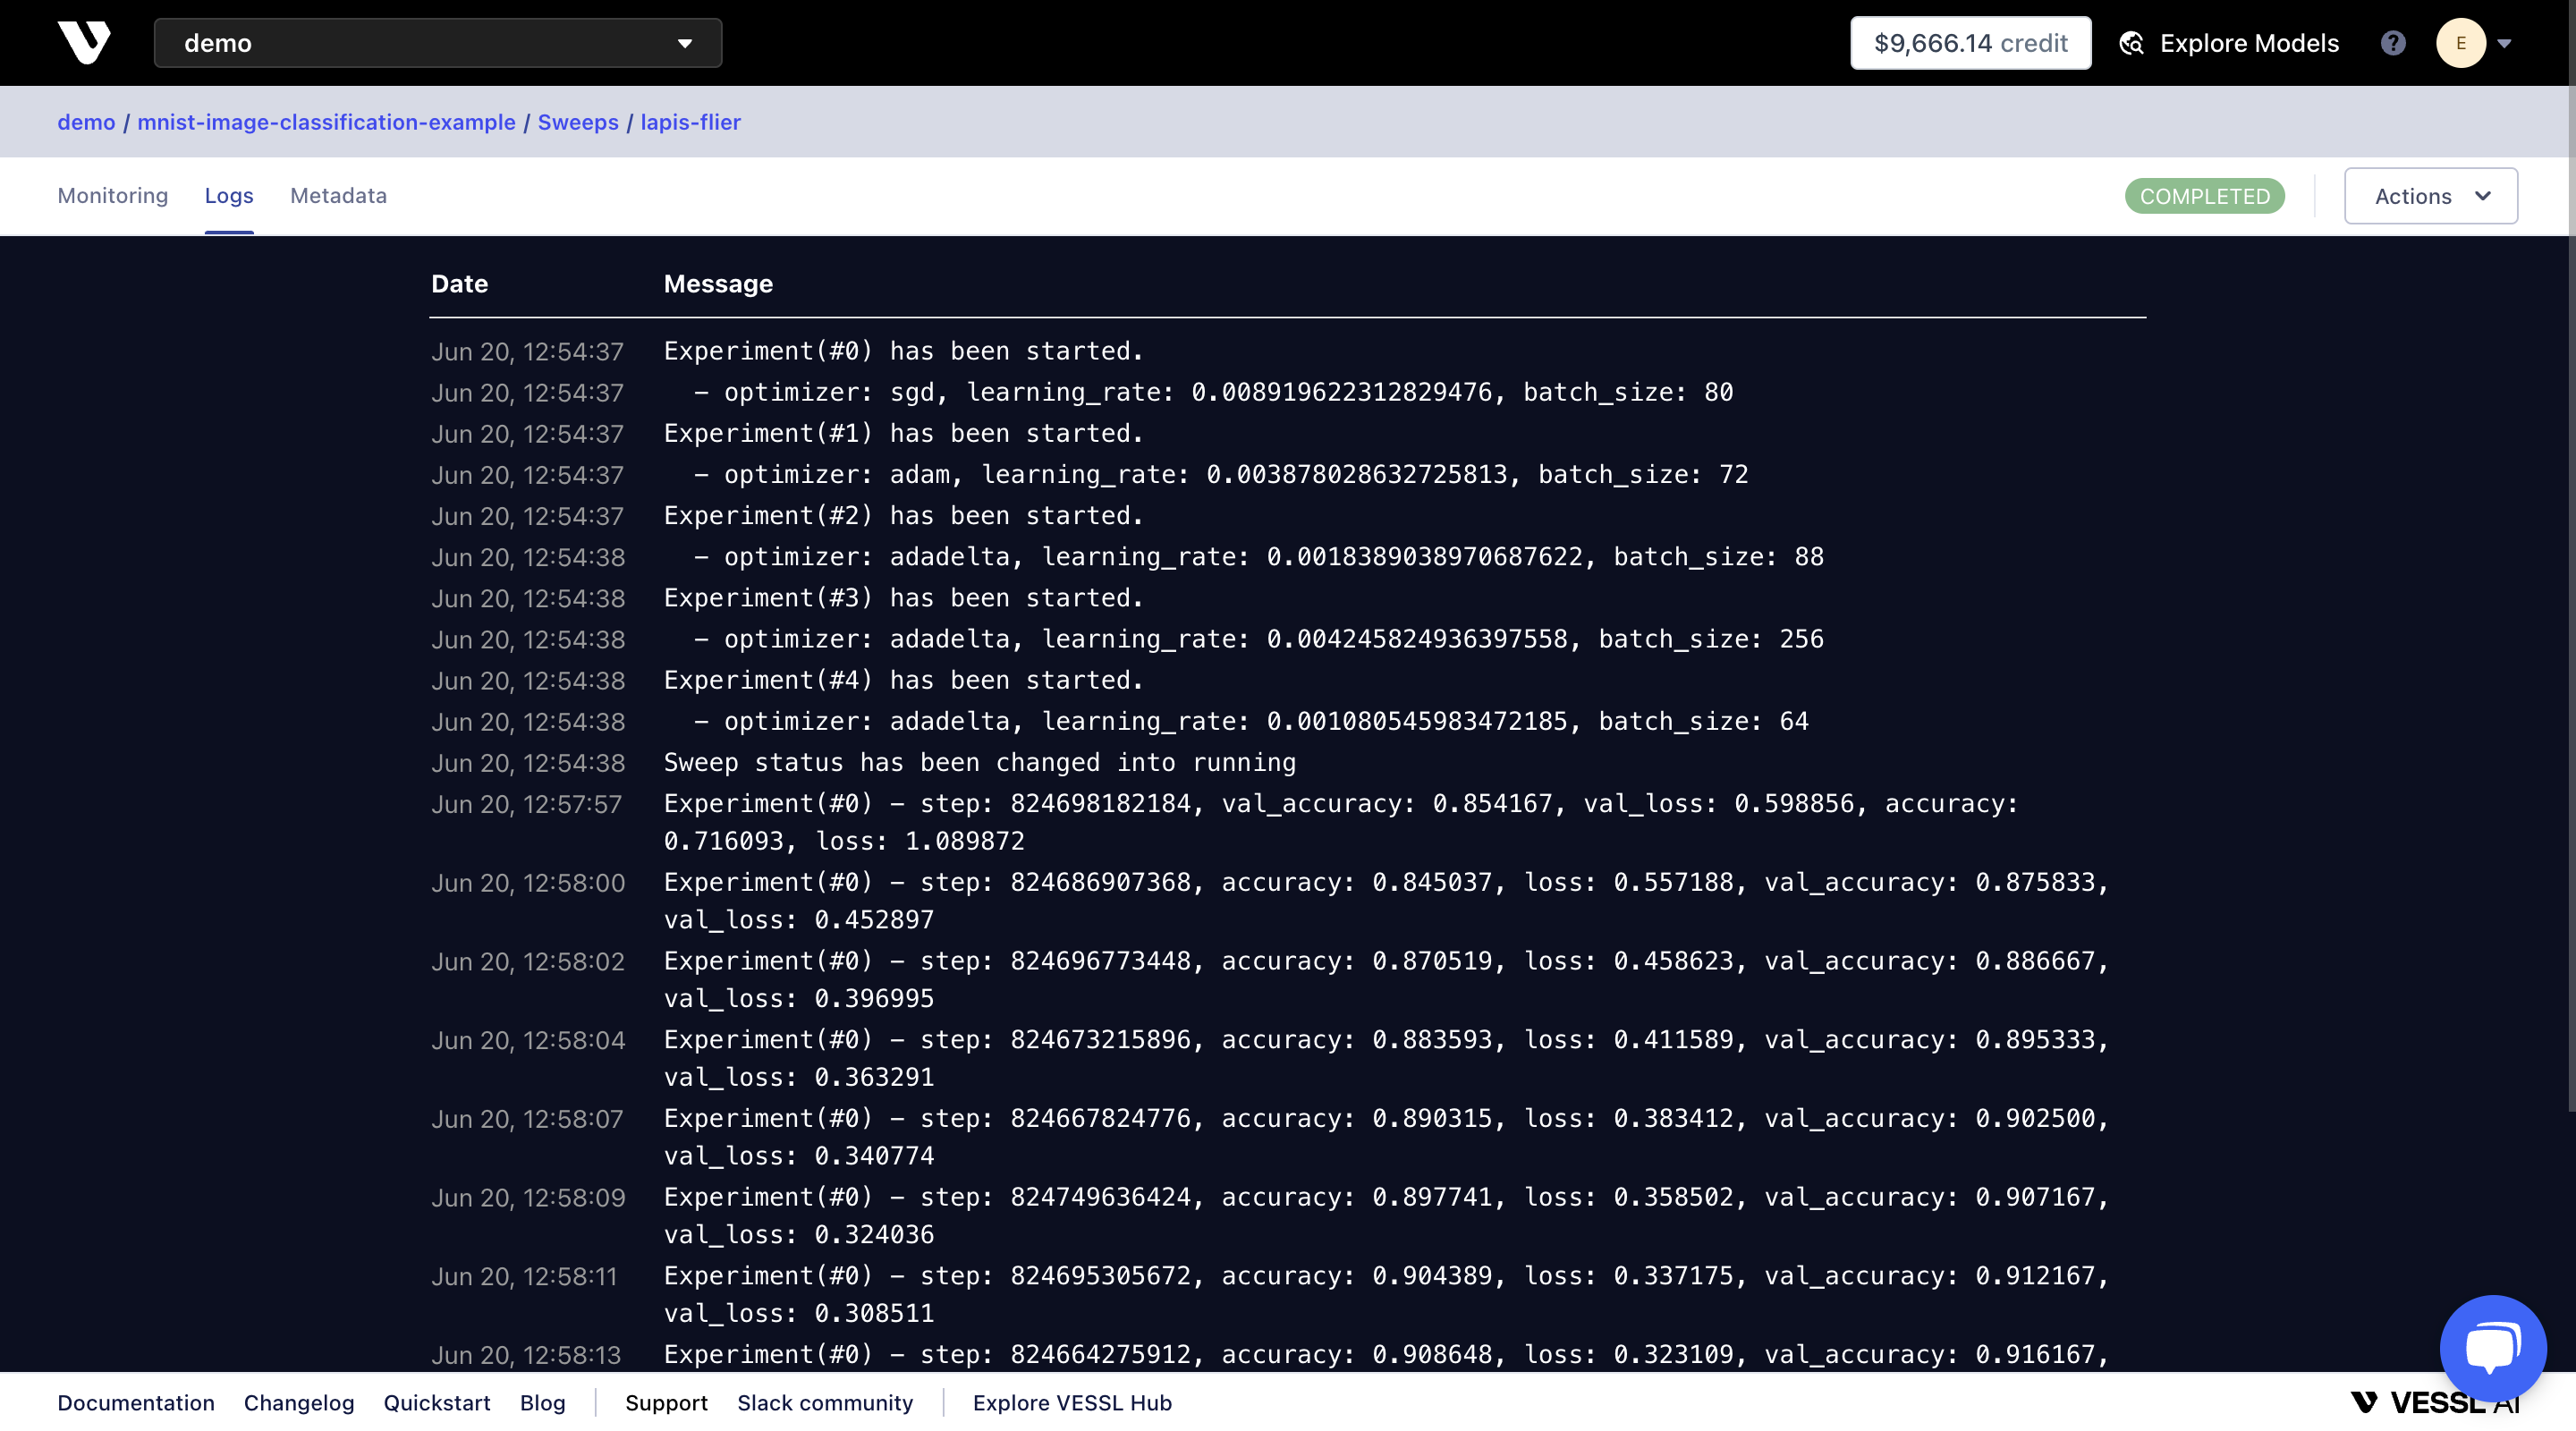
Under **LOGS** tab, you can find logging records with experiment status and metrics.
#### Metrics
Under **Metrics**, you can see the metrics that you have logged to the VESSL server using `vessl.log()` or `VesslCallback()` in VESSL SDK. Each experiment is colored differently. You can hide experiments from the plot by toggling the view button.
#### Sweep
Under **Sweep**, you can see the visualization of multiple experiments. Each curve represents an experiment and you can view the details of the experiment by hovering on the curve.
#### System Metrics
Under **System Metrics**, you can monitor the resource consumption of each experiment. If you are using a GPU acceleration, you will be able to monitor GPU utilization as well.
### Logs
Under **LOGS** tab, you can find logging records with experiment status and metrics.
 ### Metadata
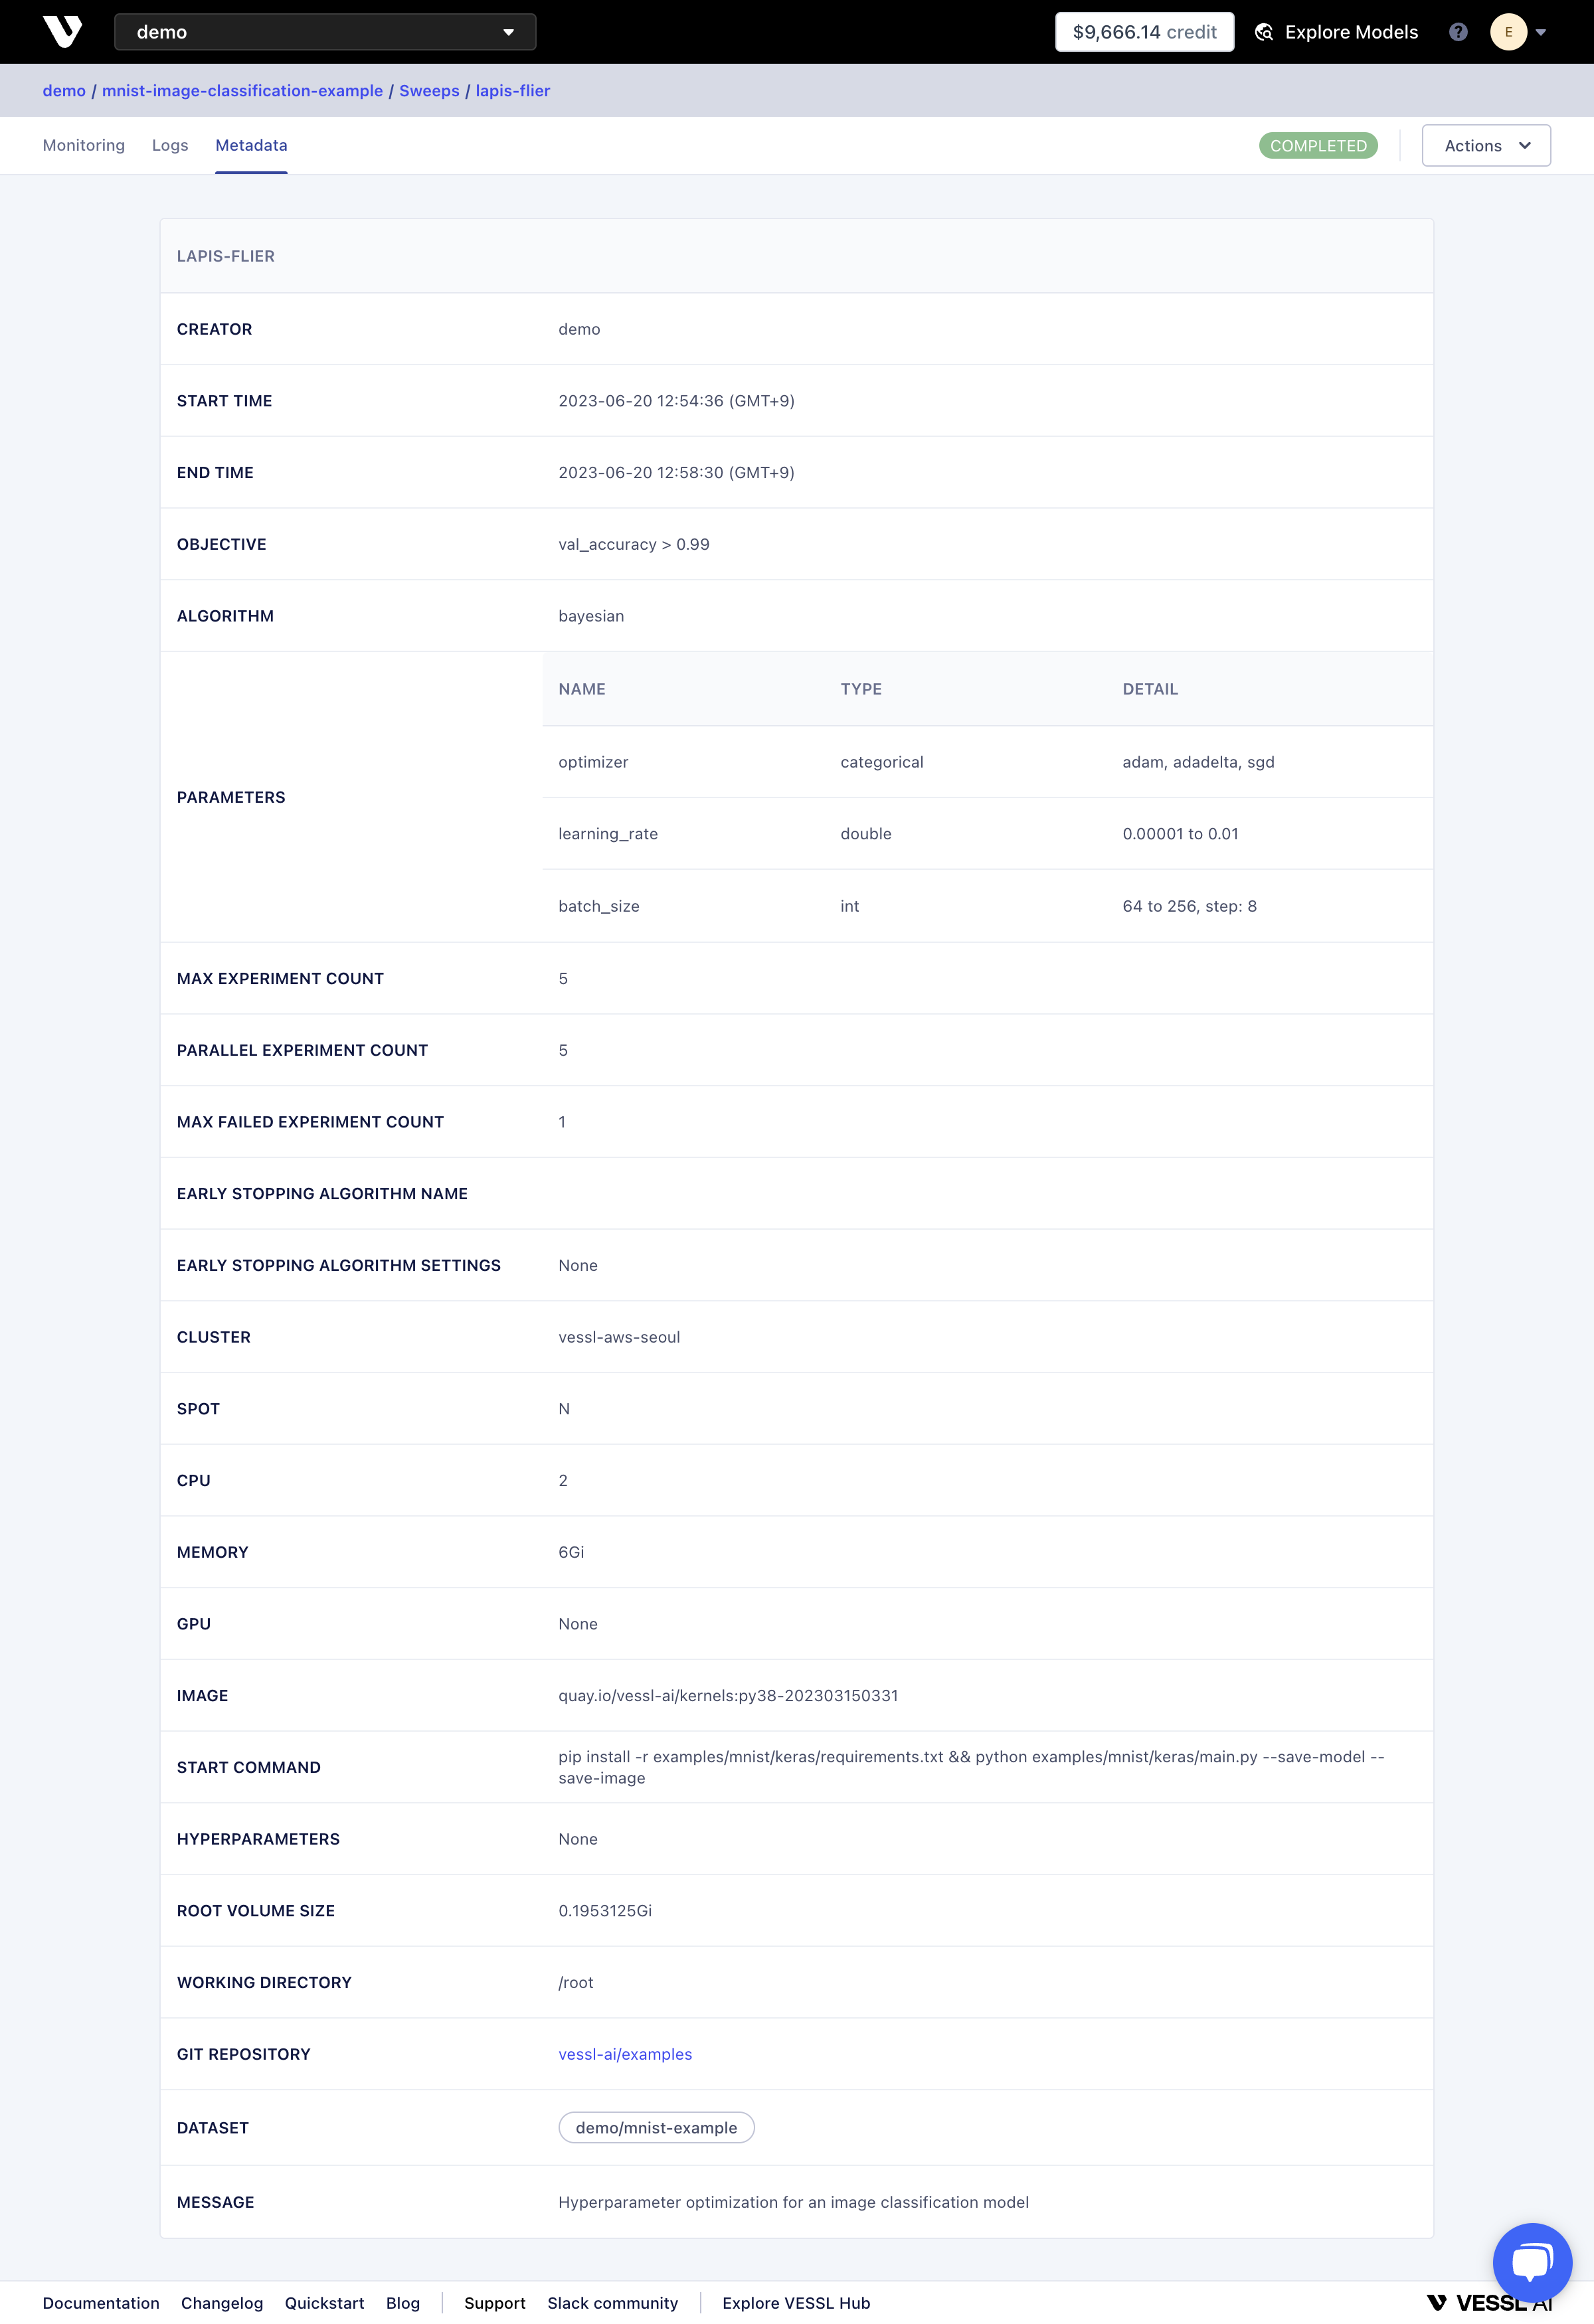
Under **METADATA**, you can find the configuration for the current Sweep and runtime.
### Metadata
Under **METADATA**, you can find the configuration for the current Sweep and runtime.