> ## Documentation Index
> Fetch the complete documentation index at: https://docs.vessl.ai/llms.txt
> Use this file to discover all available pages before exploring further.
# Service metrics
## Metrics
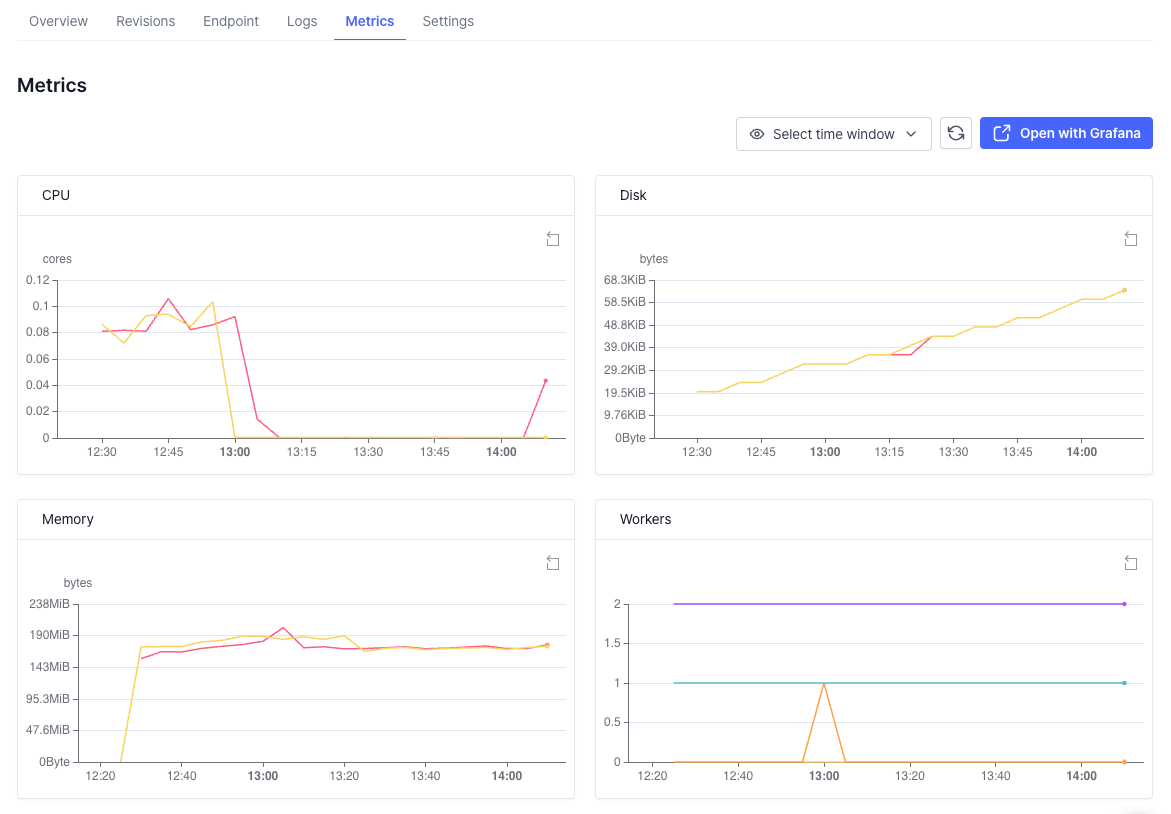
The Metrics tab provides a detailed view of the system metrics for your services (Provisioned and Serverless Mode). You can monitor various performance metrics and visualize them using Grafana dashboards.
 ### CPU
The CPU section displays the usage of CPU resources by the service workers. This helps in understanding the computational load and optimizing resource allocation.
### Memory
The Memory section shows the memory consumption by the service workers. Monitoring memory usage is crucial for ensuring that your services run efficiently without exhausting available memory.
### Network
The Network section provides insights into the network input/output statistics. This includes data on network traffic, helping you to manage bandwidth and identify potential network issues.
### Workers
The Workers section tracks the number of active workers and their status. This information is essential for understanding worker utilization and managing the scaling of your services.
## Custom metric dashboards
Our Prometheus collects your logs and metrics. You can easily integrate your metrics with Grafana, which we provide.
If you want to use custom metrics, click the `Open with Grafana` button in Metrics tab.
### CPU
The CPU section displays the usage of CPU resources by the service workers. This helps in understanding the computational load and optimizing resource allocation.
### Memory
The Memory section shows the memory consumption by the service workers. Monitoring memory usage is crucial for ensuring that your services run efficiently without exhausting available memory.
### Network
The Network section provides insights into the network input/output statistics. This includes data on network traffic, helping you to manage bandwidth and identify potential network issues.
### Workers
The Workers section tracks the number of active workers and their status. This information is essential for understanding worker utilization and managing the scaling of your services.
## Custom metric dashboards
Our Prometheus collects your logs and metrics. You can easily integrate your metrics with Grafana, which we provide.
If you want to use custom metrics, click the `Open with Grafana` button in Metrics tab.
 If you are not familiar with Grafana, please refer to the [PromQL documentation](https://prometheus.io/docs/prometheus/latest/querying/basics/) and the [Grafana documentation](https://grafana.com/docs/).