> ## Documentation Index
> Fetch the complete documentation index at: https://docs.vessl.ai/llms.txt
> Use this file to discover all available pages before exploring further.
# Tracking runs
## Run summary
The summary tab provides a comprehensive overview of all run configurations. It displays sections such as metadata, resources, task, and environment variables, which reflect the settings and parameters selected at the time of creation. This tab allows users to review the configurations applied to each run.
## Logs
The logs tab provides detailed, real-time information about the status and progress of your workload. This tab is essential for monitoring and troubleshooting processes. You can monitor the logs from the Docker container including status updates and `print()` statements. Here's a breakdown of what each entry in the log represents:
* **Timestamp**: Each entry is prefixed with a timestamp indicating when the event occurred. This helps in tracking the chronological order of events.
* **Workload status**: Displays the current status of the workload, such as "awaiting to start," "pending," "initializing," "running," and "terminated." These statuses provide insights into the lifecycle of the workload.
* **Container management**:
* **Assignment**: Shows which node or resource the workload has been assigned to, such as `afcwn4qtal66/run-execution-tn135slf9wv1-0`.
* **Container operations**: Logs the creation, starting, pulling, and stopping of containers, helping users understand resource allocation and container lifecycle.
* **Resource utilization**:
* **Image pulling**: Logs the pulling of images, including the time taken for each operation. This information is useful for diagnosing network or registry-related delays.
* **Git operations**: Displays Git commands executed, such as repository cloning and branch operations, providing transparency on code and version control actions.
* **Package installation**:
* **Dependencies**: Records the installation of Python packages and any warnings or errors encountered, useful for debugging dependency issues.
* **CLI tools**: Logs the installation of command-line tools, like VESSL CLI, and any related messages or errors.
* **Warnings and errors**: Highlights any warnings or errors encountered during the workload execution. Users should pay attention to these entries to address potential issues, such as package conflicts or permission warnings.
* **Execution and termination**:
* **Process execution**: Logs the execution of scripts or commands, such as launching a Streamlit, Gradio app, including network URLs for accessing applications.
* **Termination requests**: Indicates when a workload has been requested to terminate and logs the stopping of containers, providing insight into how and when processes are being concluded.
### Plots
The plots tab provides an overview of key metrics for your runs, such as accuracy and loss. You can also filter out the outliers by checking **Ignore outlier** box and controlling the **Smoothing** of the curves.
### VESSL Python SDK
VESSL Python SDK enables you to view metrics, and multimedia files.
View the system metrics (usage of CPU, memory, network) with Python SDK.
View the image files with Python SDK in the Media section.
View the audio files with Python SDK in the Media section.
### Multimedia
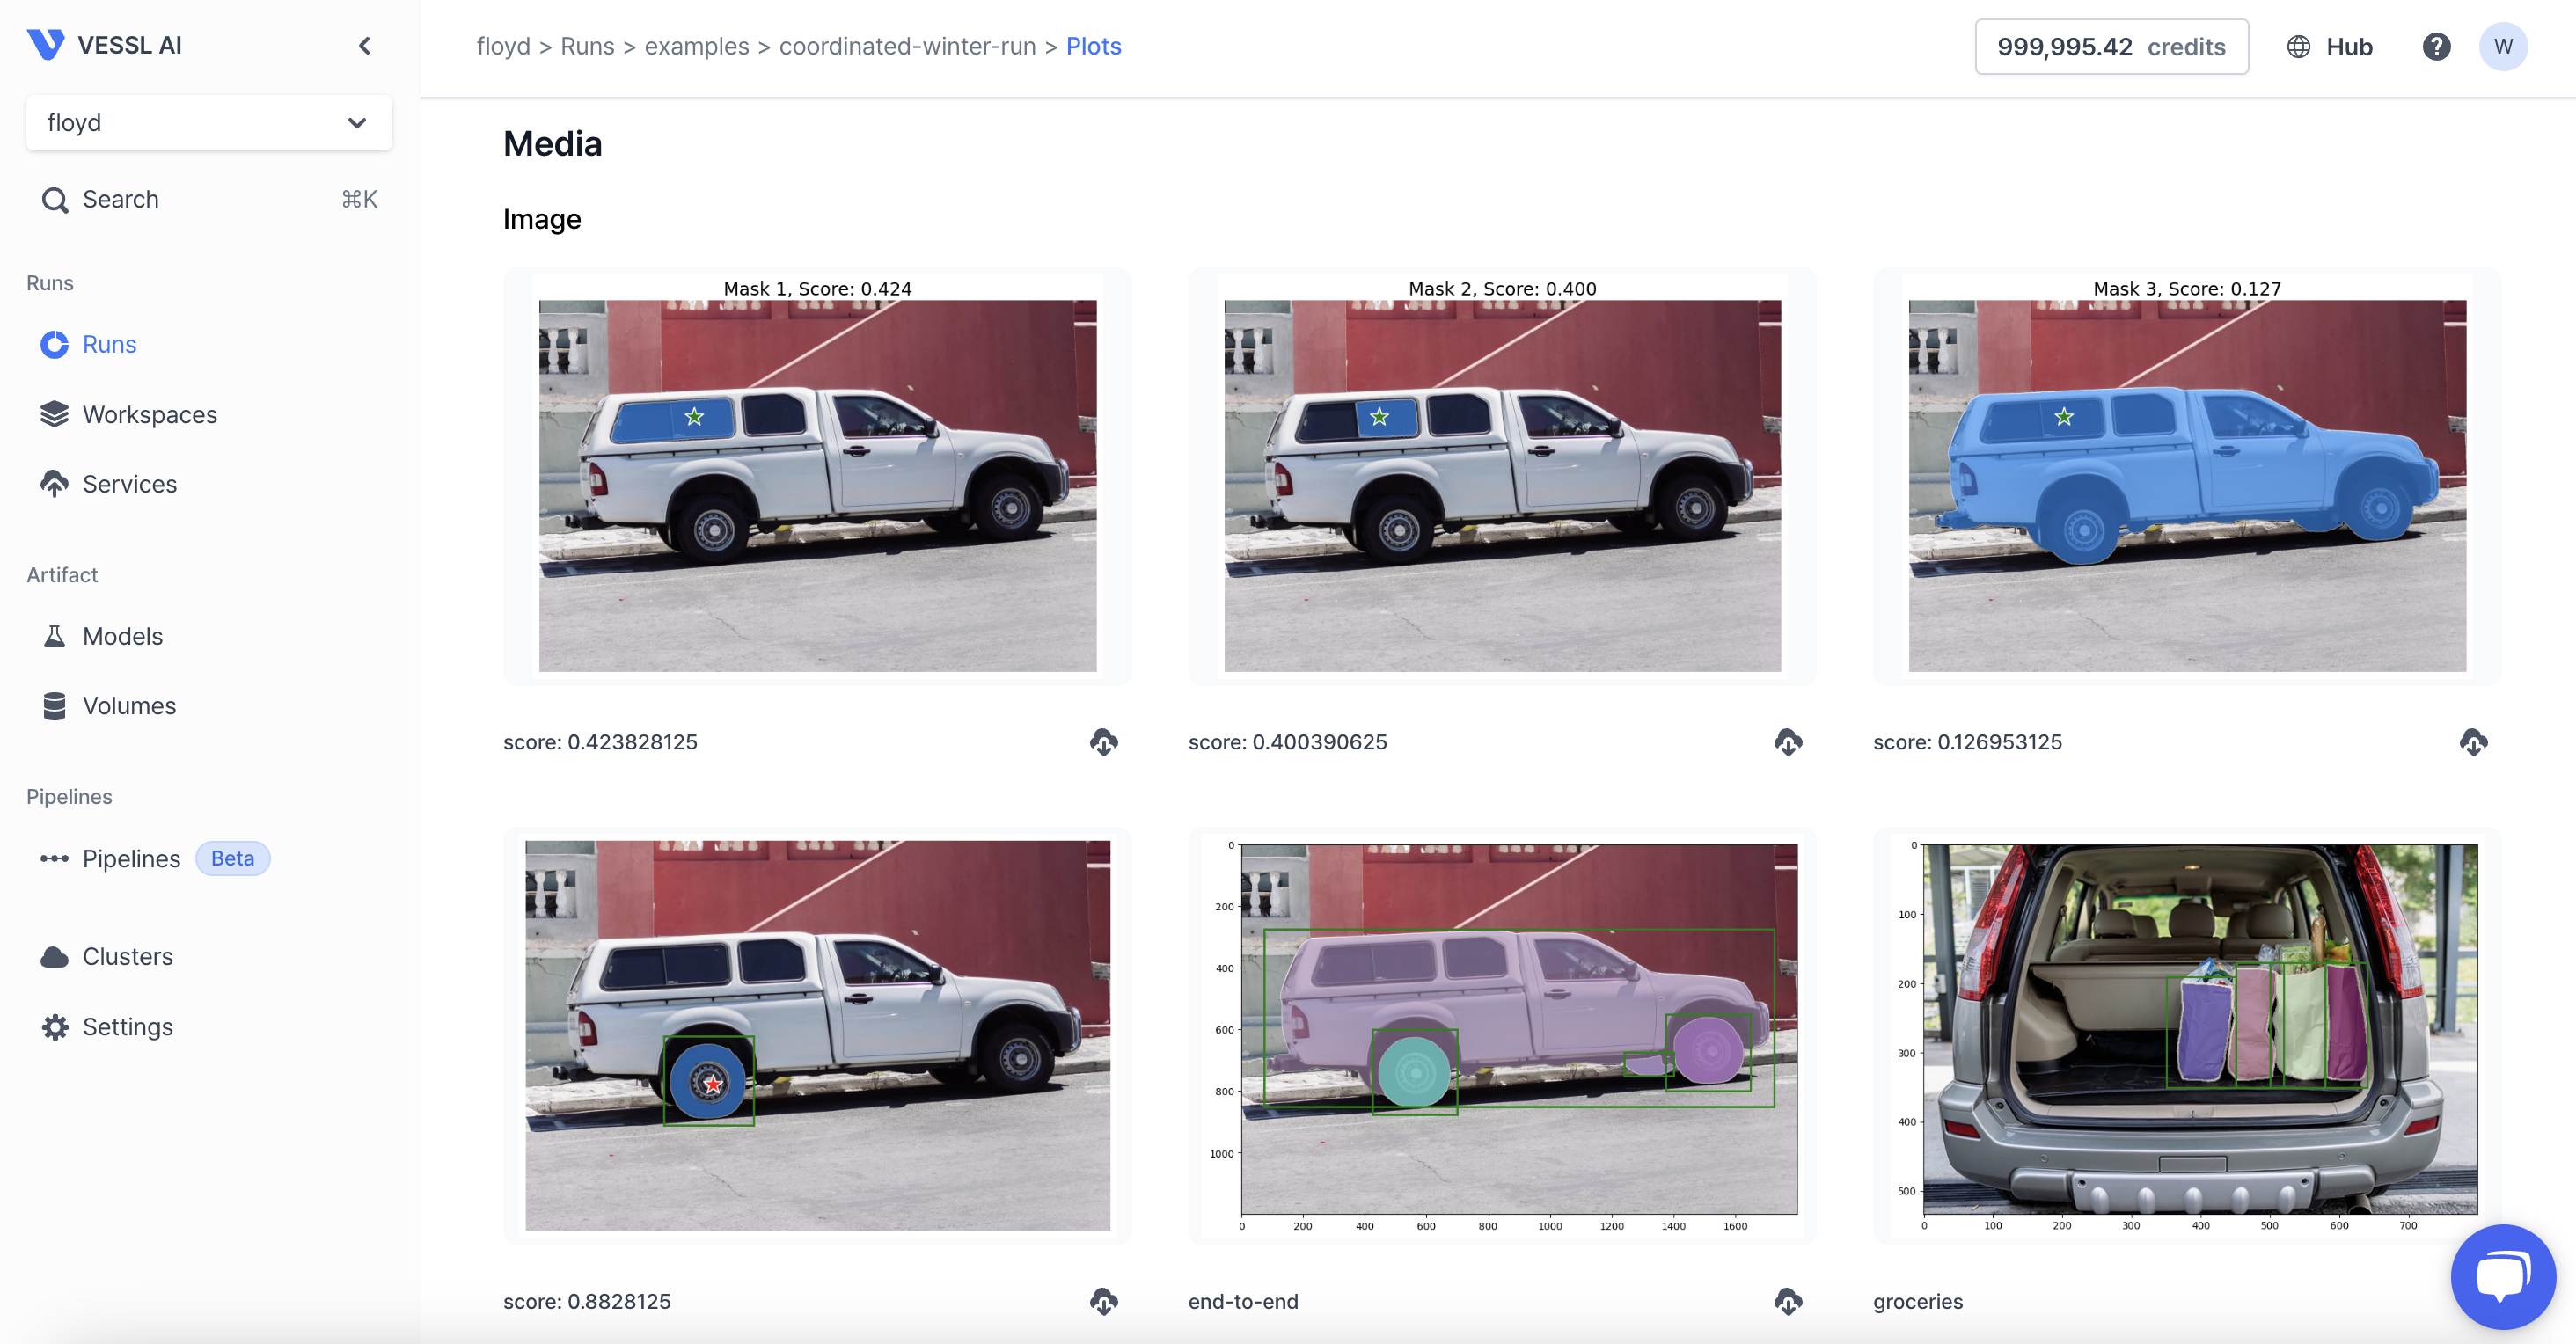
You can also view images. You can configure the number of displayed images using VESSL Python SDK.
 ### System Metrics
You can monitor system metrics such as CPU, GPU, memory, disk, and network usage.
### System Metrics
You can monitor system metrics such as CPU, GPU, memory, disk, and network usage.
 ## Files
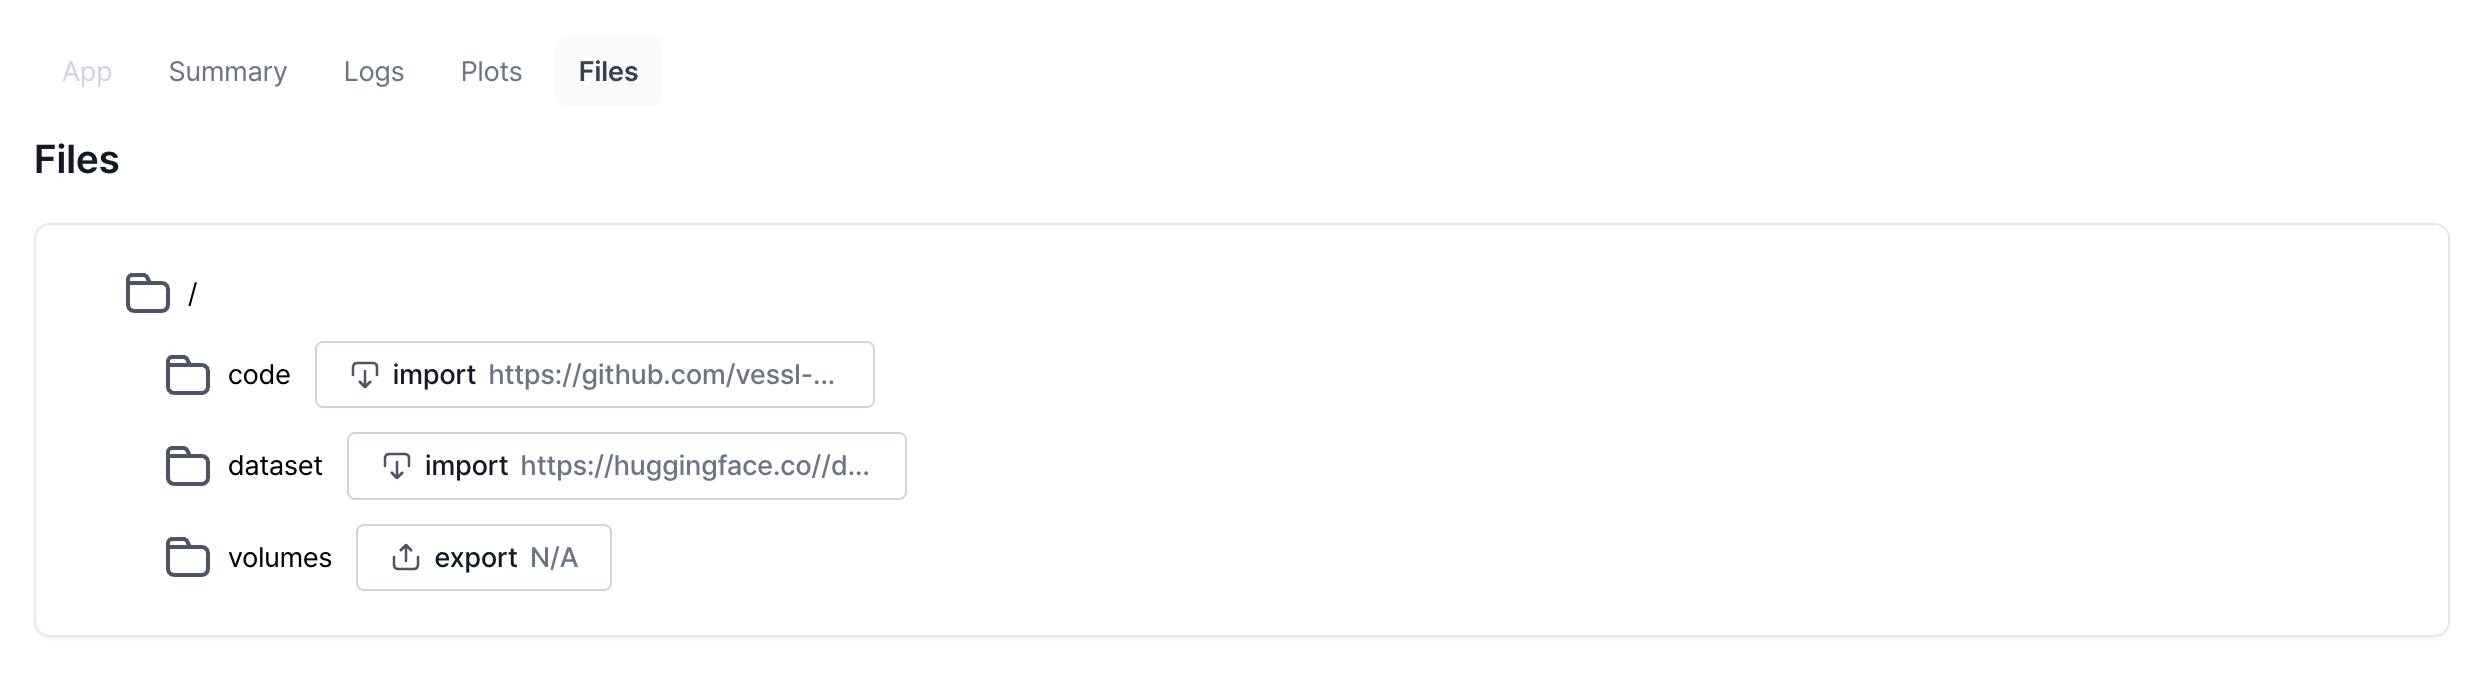
The files tab guides you to navigate and download the output and input files. You can also do this using VESSL Client CLI.
## Files
The files tab guides you to navigate and download the output and input files. You can also do this using VESSL Client CLI.