> ## Documentation Index
> Fetch the complete documentation index at: https://docs.vessl.ai/llms.txt
> Use this file to discover all available pages before exploring further.
# Monitor experiment results
Experiment is no longer actively maintained. For improved functionality, please use [Run](/guides/runs/overview) instead.
### Experiment Summary
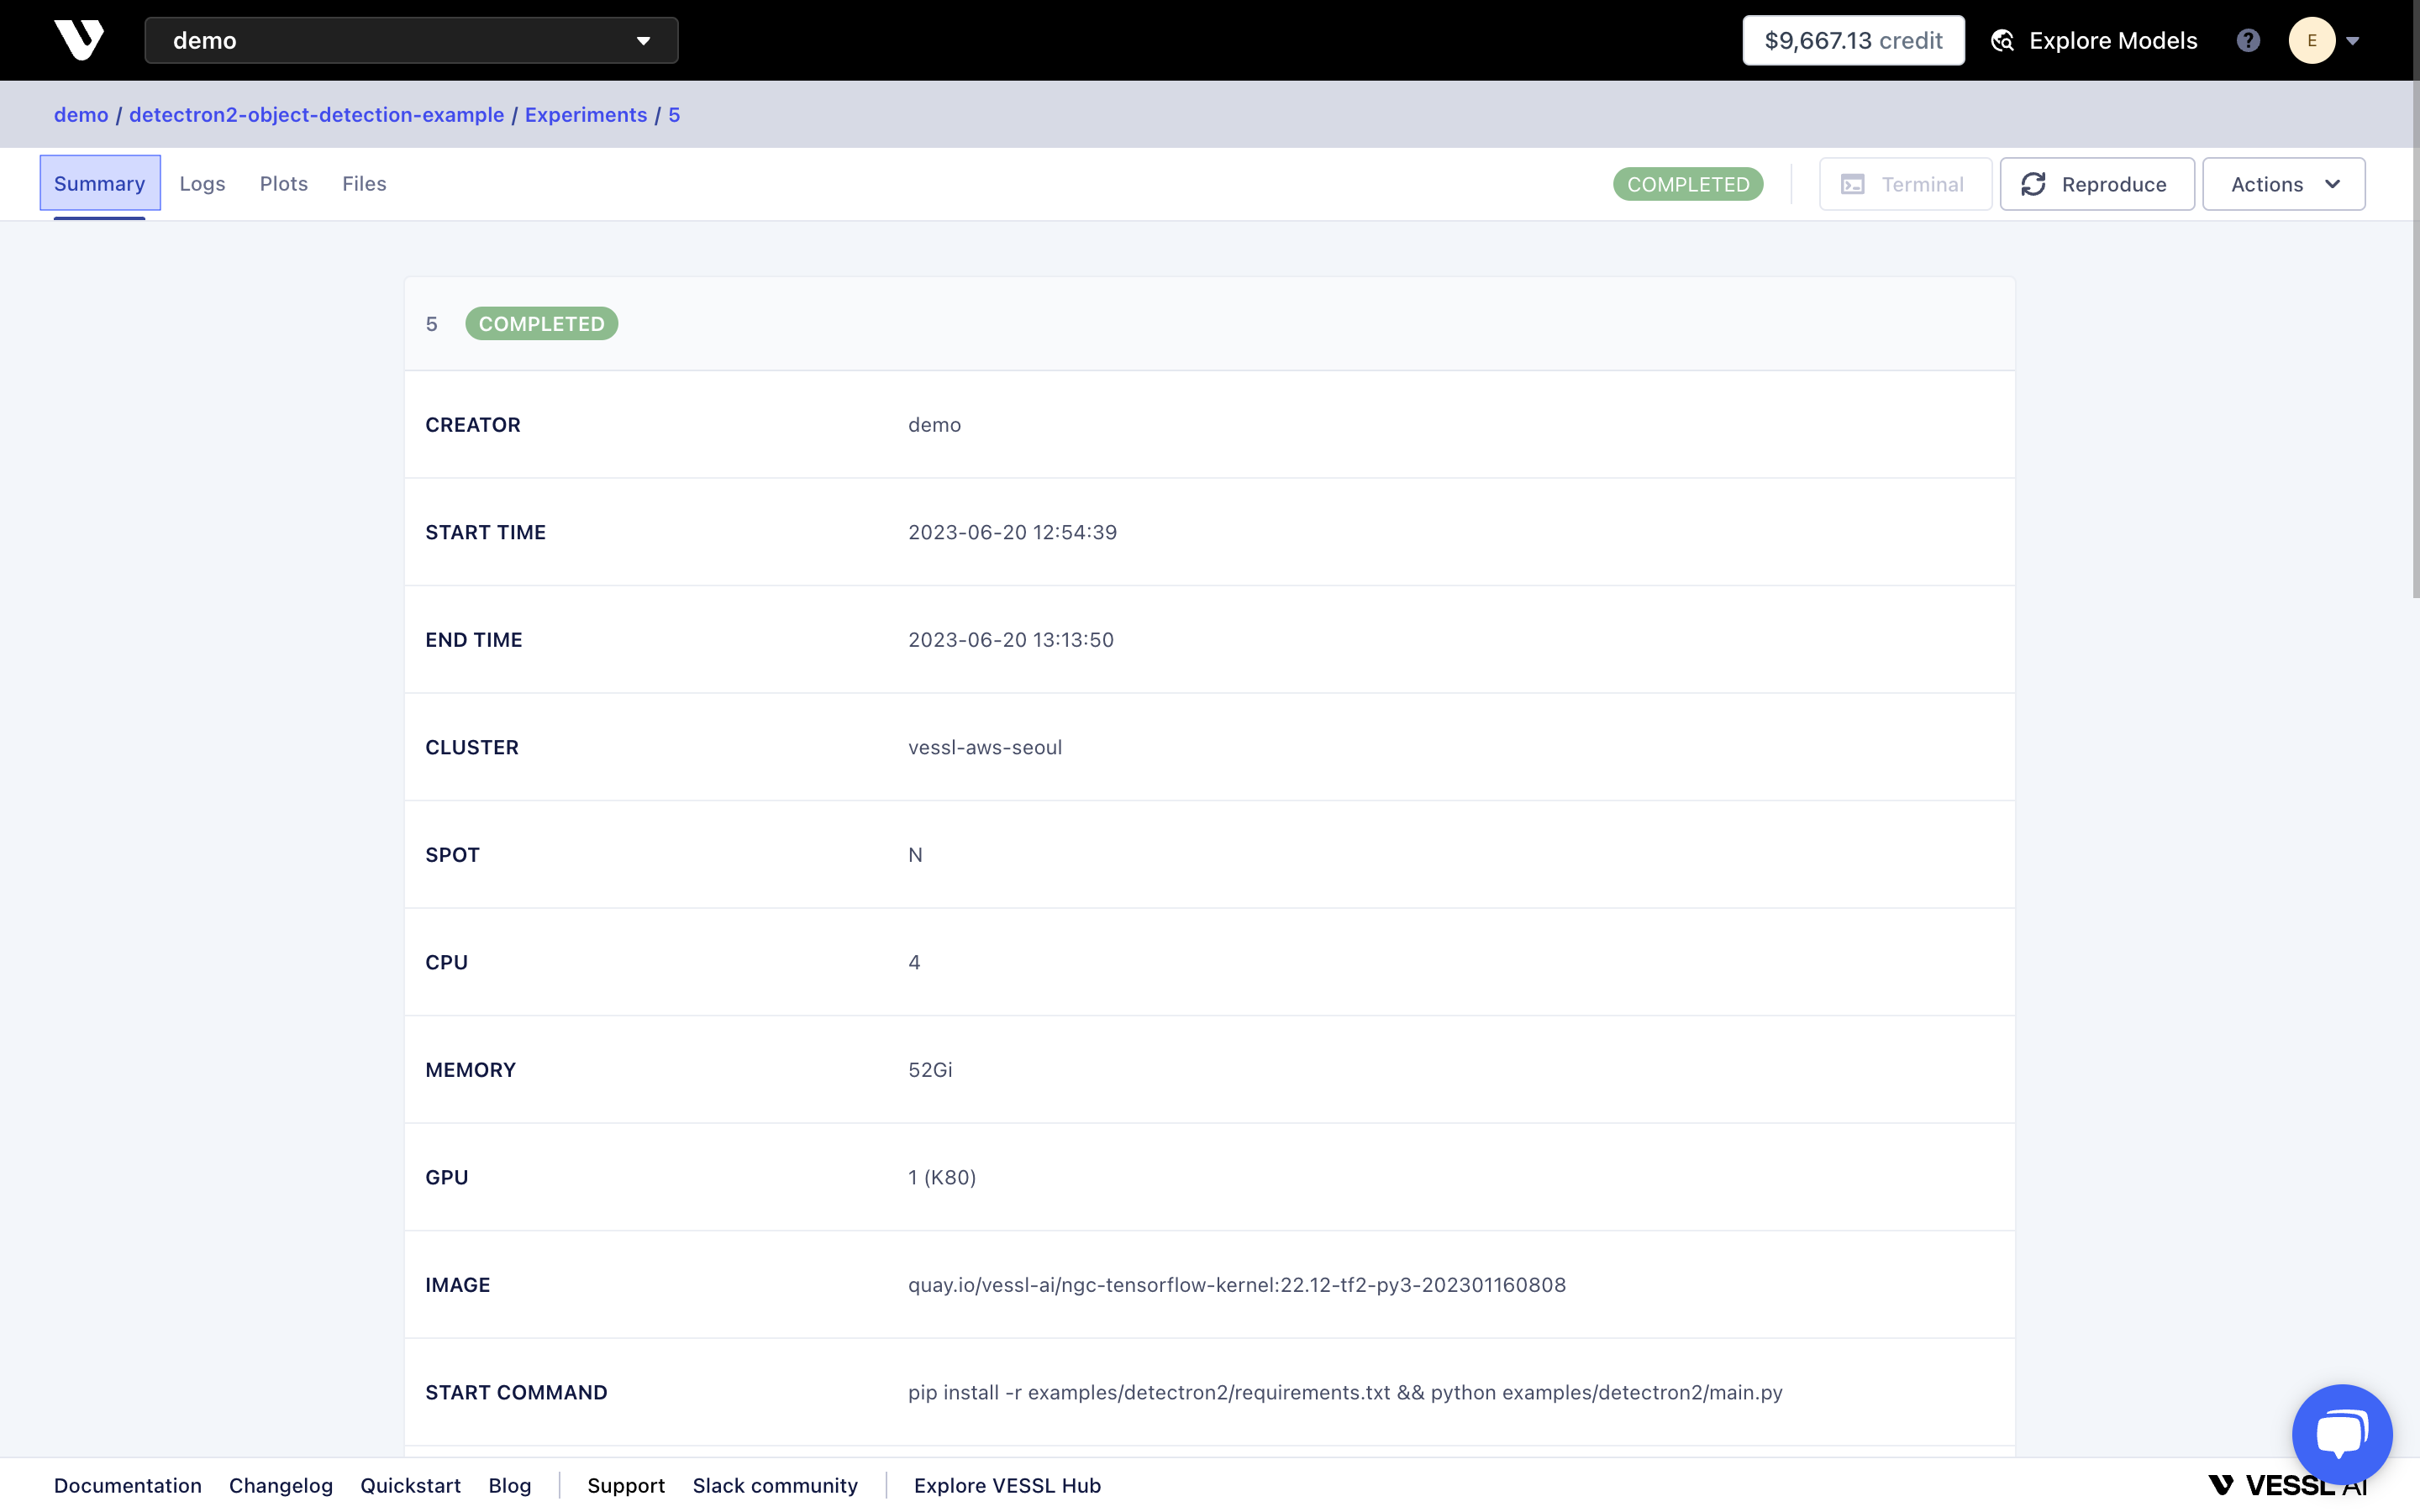
Under **SUMMARY**, you can view all the experiment configurations such as environment variables, quick reproduce via CLI, Docker image, and resource specification.
 ### Logs
Under **LOGS**, you can monitor the logs from the experiment Docker container including status updates and `print()` statements.
### Logs
Under **LOGS**, you can monitor the logs from the experiment Docker container including status updates and `print()` statements.
 ### Plots
You need to use VESSL's Python SDK to view metrics or multimedia files.
Under **PLOTS**, you can view key metrics for your experiments such as accuracy and loss. You can also filter out the outliers by checking **ignore outlier** box and controlling the **smoothing** of the curves.
### Plots
You need to use VESSL's Python SDK to view metrics or multimedia files.
Under **PLOTS**, you can view key metrics for your experiments such as accuracy and loss. You can also filter out the outliers by checking **ignore outlier** box and controlling the **smoothing** of the curves.
 #### Multimedia
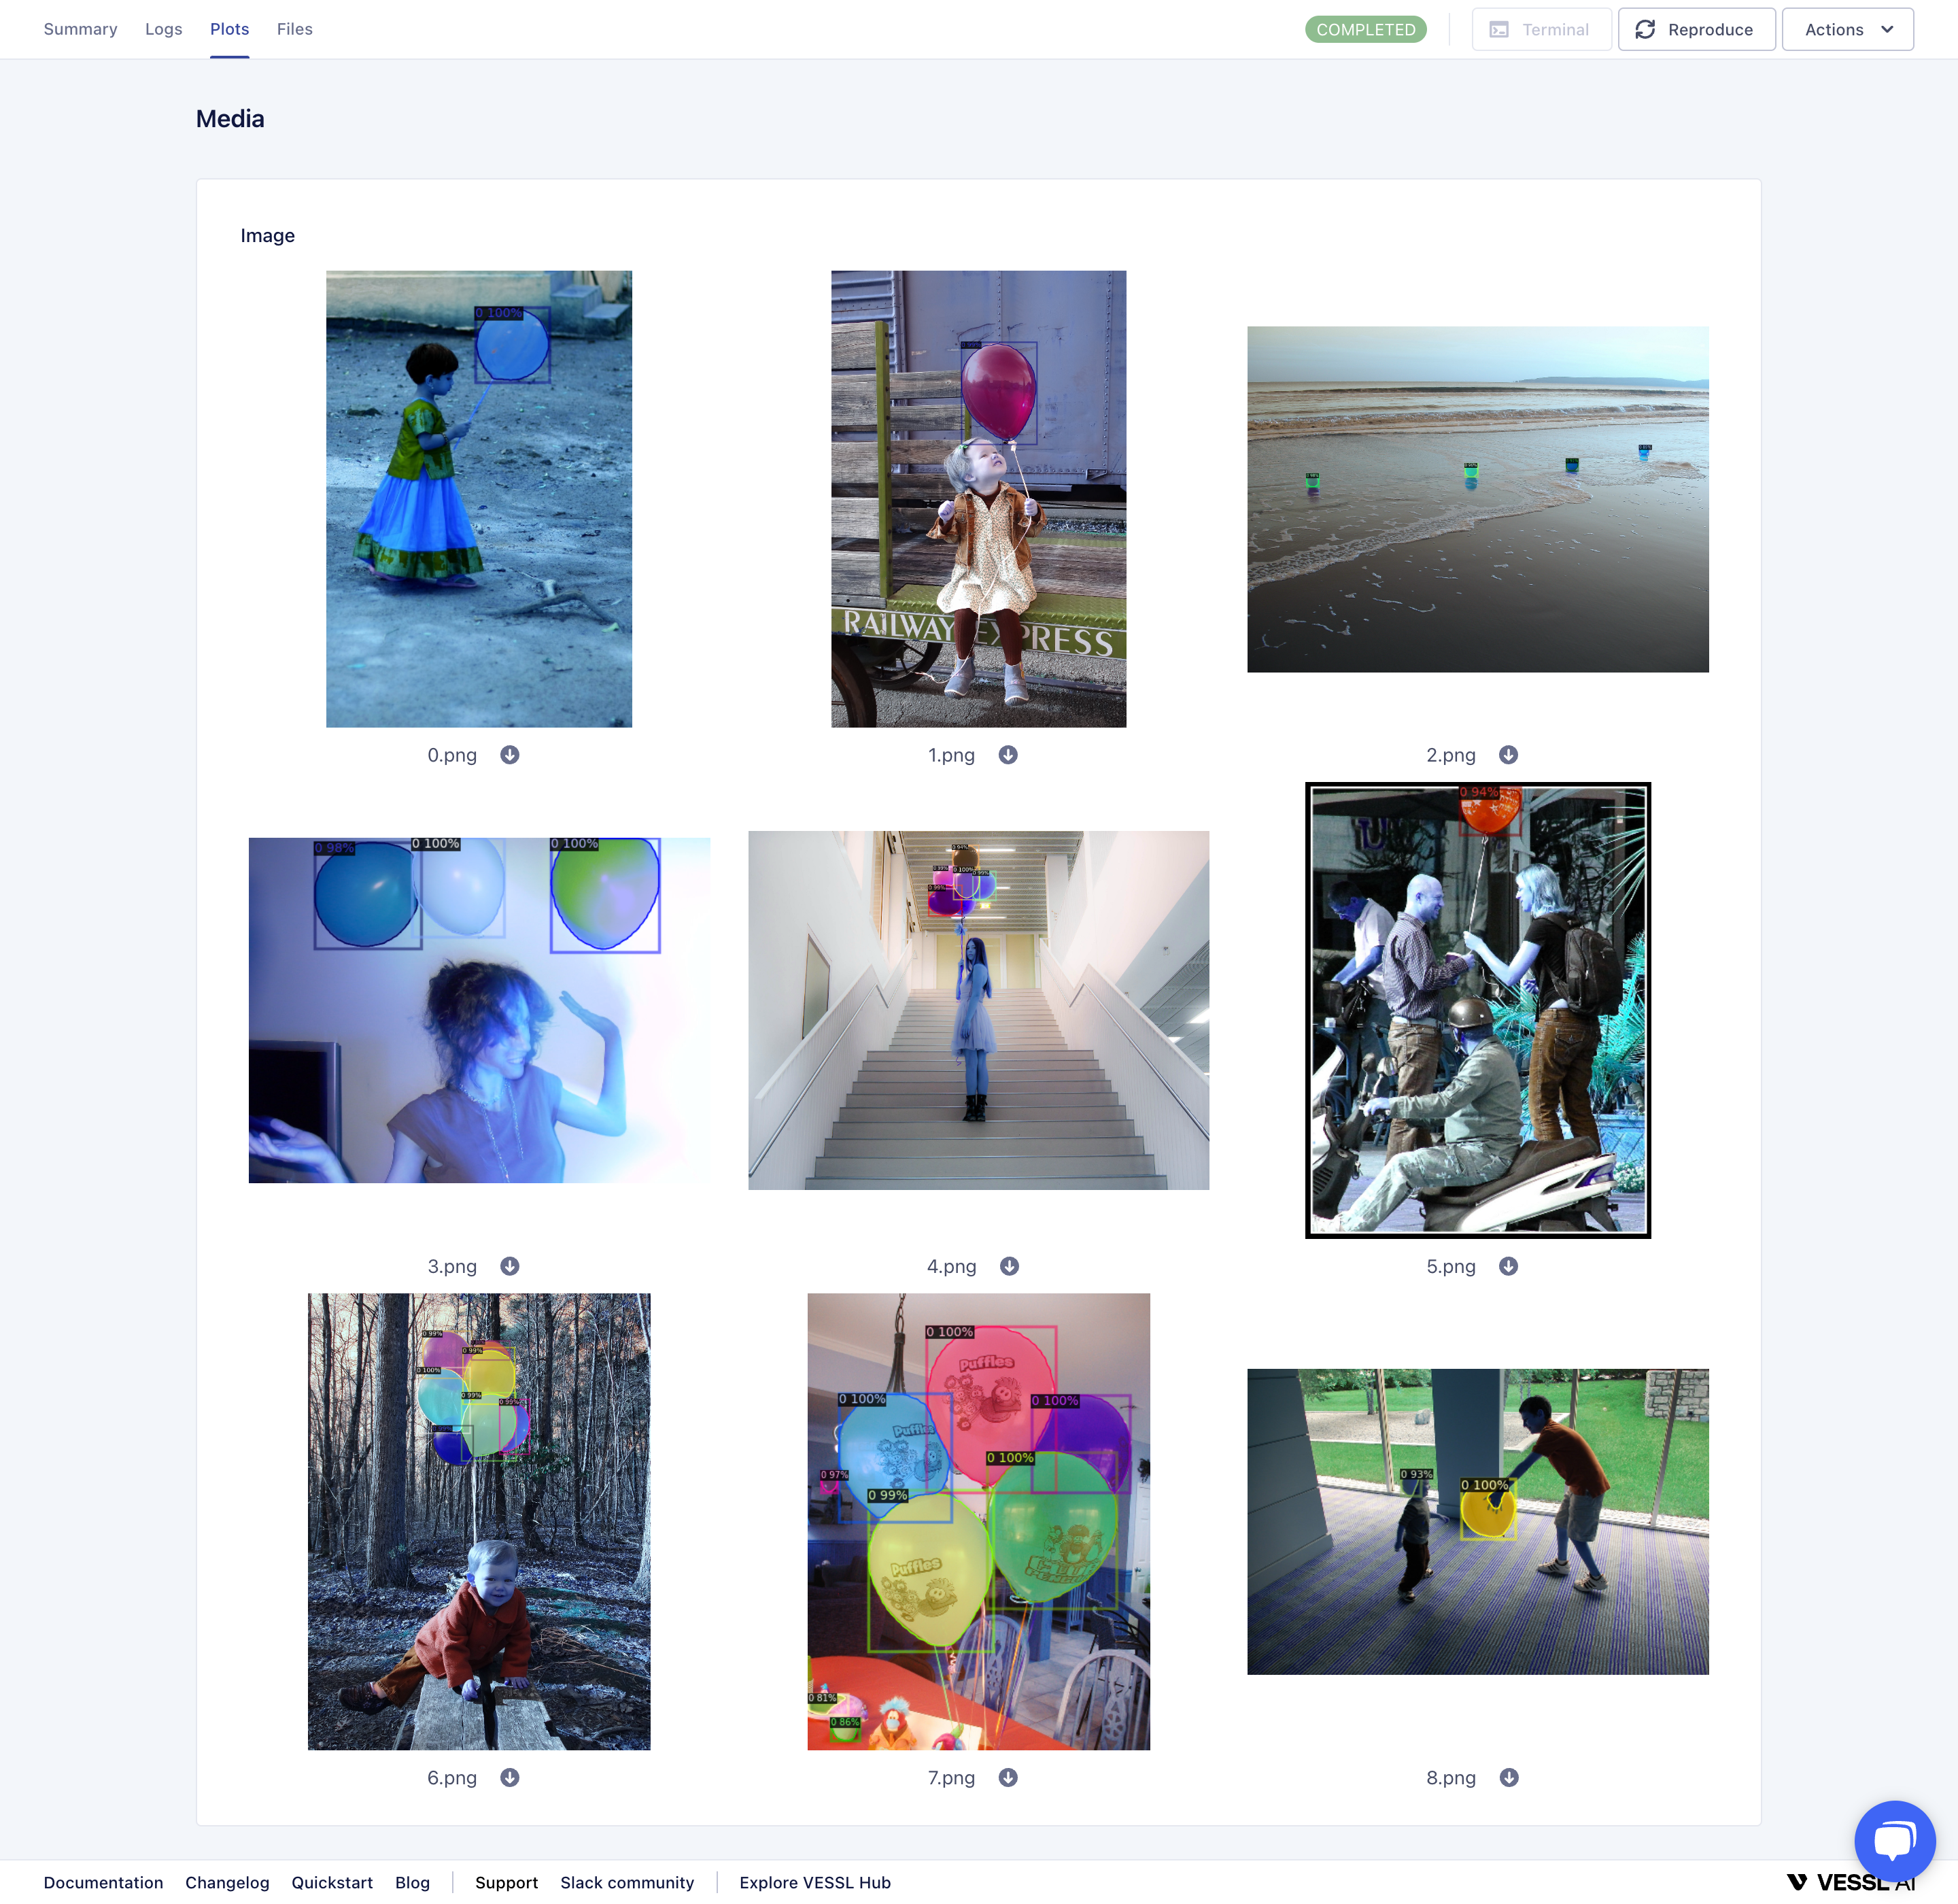
You can also view images. You can configure the number of displayed images using VESSL's Python SDK.
#### Multimedia
You can also view images. You can configure the number of displayed images using VESSL's Python SDK.
 #### System Metrics
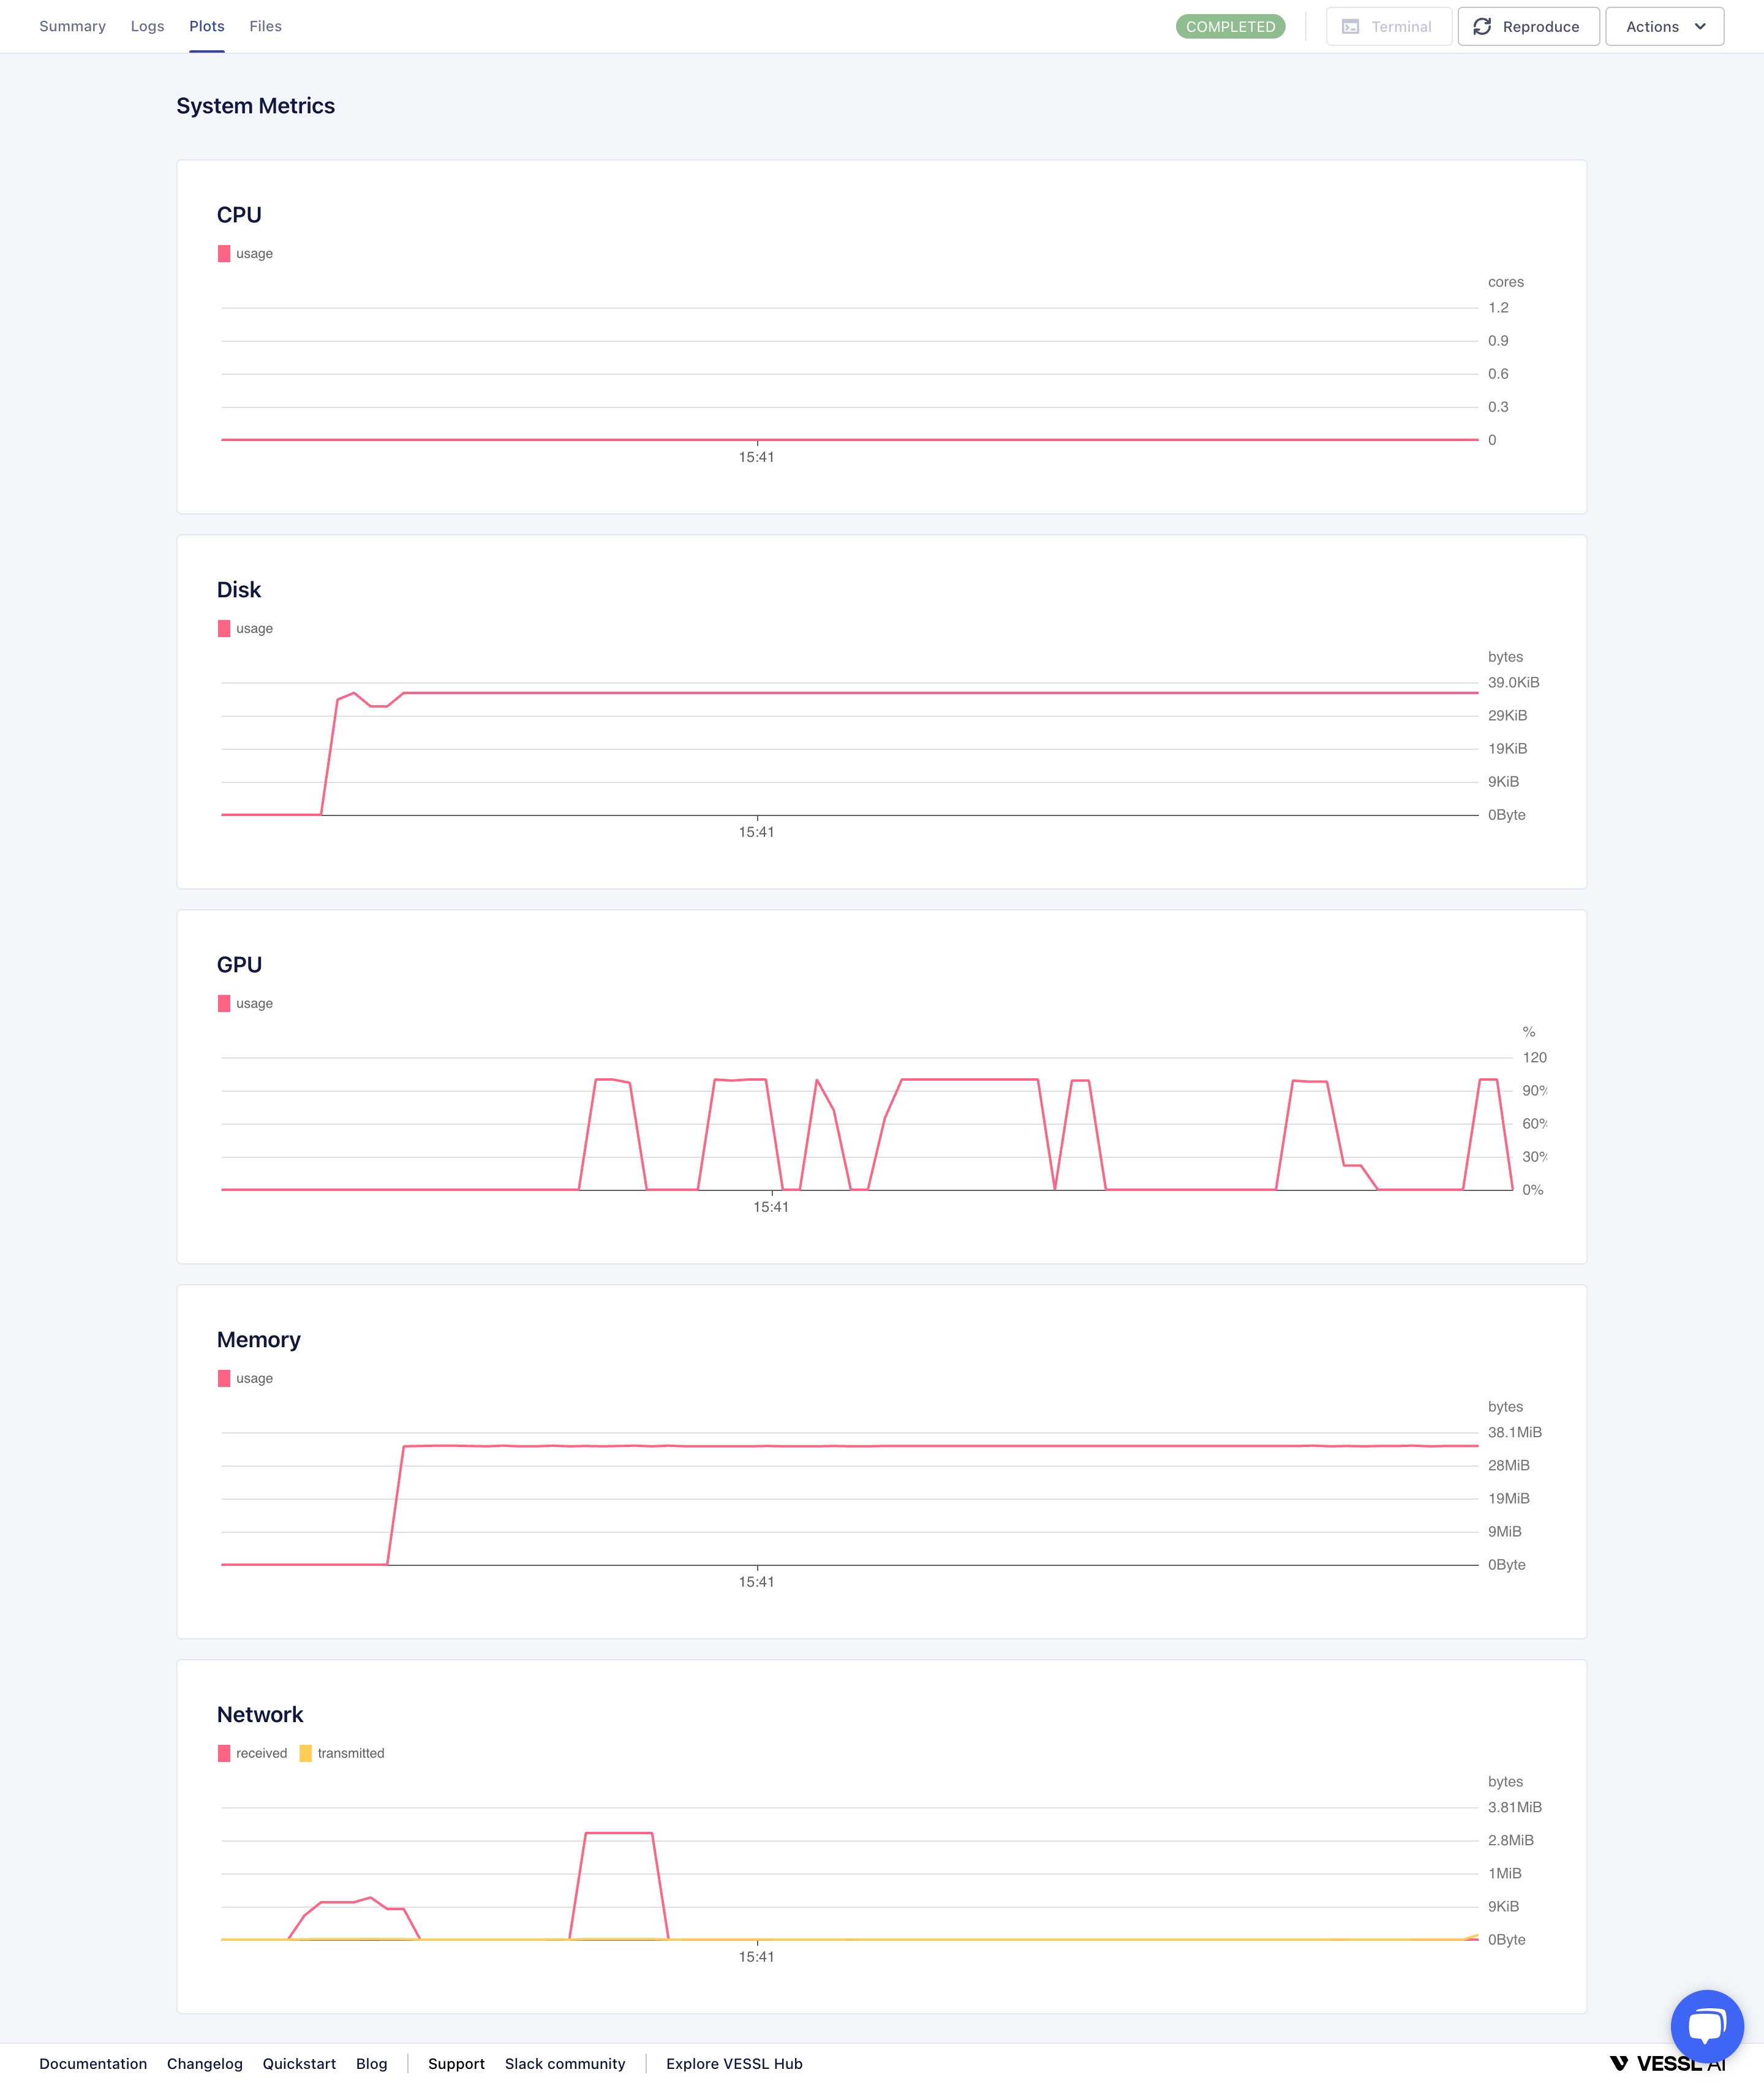
You can monitor system metrics such as CPU, GPU, memory, disk, and network usage.
#### System Metrics
You can monitor system metrics such as CPU, GPU, memory, disk, and network usage.
 ### Files
Under **FILES**, you can navigate and download the output and input files. You can also do this using VESSL Client CLI.
### Files
Under **FILES**, you can navigate and download the output and input files. You can also do this using VESSL Client CLI.
