> ## Documentation Index
> Fetch the complete documentation index at: https://docs.vessl.ai/llms.txt
> Use this file to discover all available pages before exploring further.
# Monitor clusters
**VESSL Clusters** comes with a built-in **cluster dashboard** that provides a visualization of cluster usage and status down to each node and workload. This is enabled by the **VESSL Cluster Agent** which sends real-time information about the clusters and workloads running on the cluster such as node specifications and model metrics.
Take a quick 2-minute tour of how to monitor clusters using the demo below.
The dashboard is automatically set up when you integrate your cloud or on-premises servers using the `vessl cluster create` command.
Users on the **Enterprise plan** can use the customized **VESSL Cluster Agent**
to route the monitoring information to your monitoring tools like Datadog and
Grafana. Contact us at [support@vessl.ai](https://vessl.ai/talk-to-sales) to
get more details.
## Cluster-level monitoring
Multi-cluster monitoring of resource usage and ongoing workloads is available under **Clusters**. Here, you can get an overview of the integrated clusters.
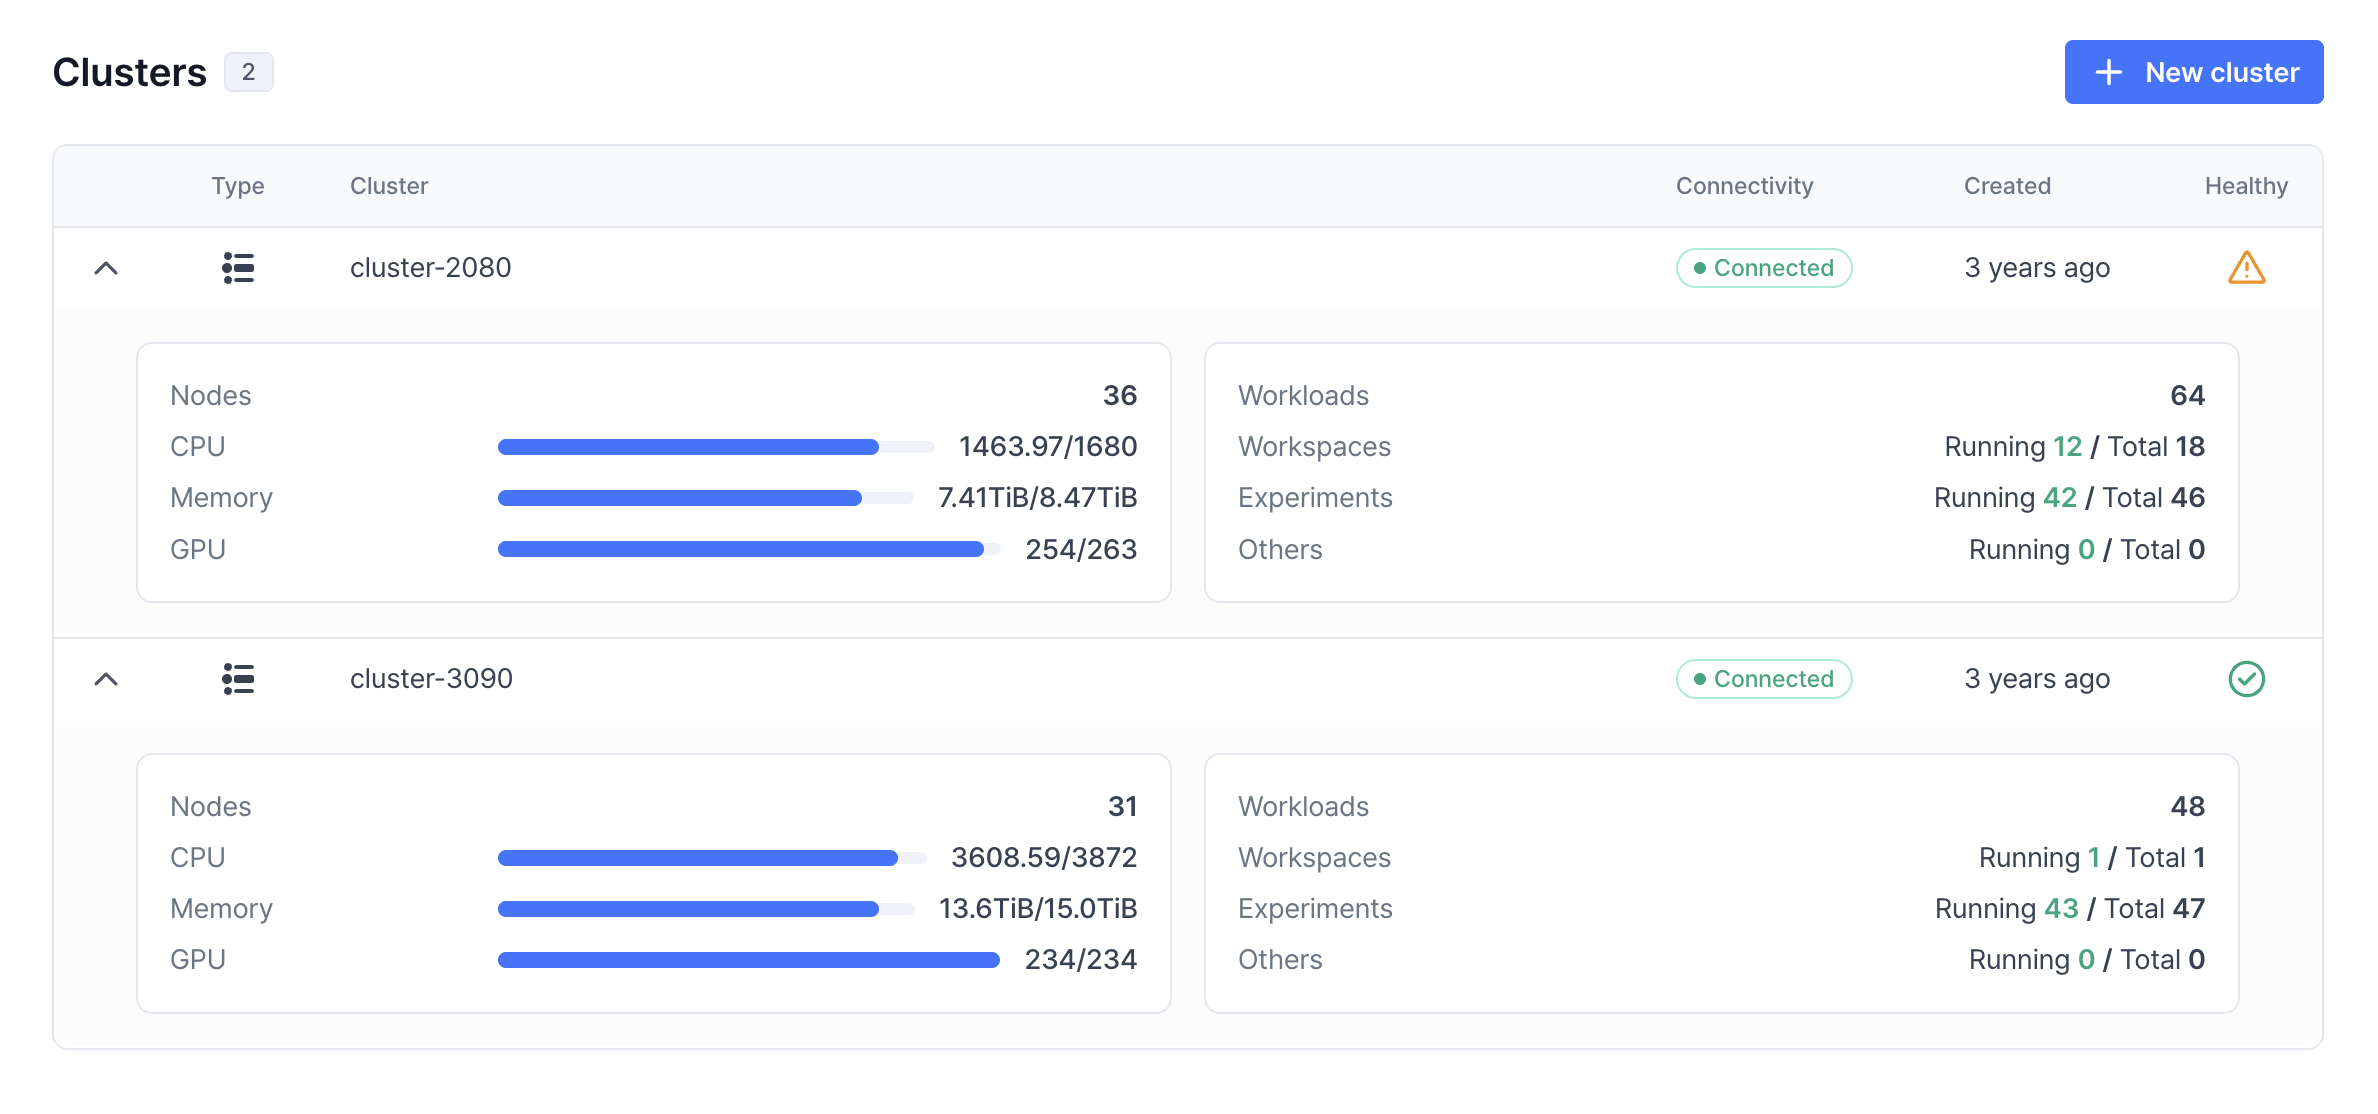 * **Healthy** — Connection and incident status of a cluster.
* **Nodes** — Total number of the worker nodes.
* **Real-time resource usage** — Real-time resource usage of the CPU cores, RAM,
and GPUs.
* **Ongoing workloads by type** — The number of running notebook servers
(**Workspaces**) and training jobs (**Experiments**).
Clicking the cluster guides you to the **Overview** tab which holds more detailed information about the cluster.
### Cluster status overview
The **Cluster status overview** section presents the basic information about the cluster including the connection and incident status.
* **Healthy** — Connection and incident status of a cluster.
* **Nodes** — Total number of the worker nodes.
* **Real-time resource usage** — Real-time resource usage of the CPU cores, RAM,
and GPUs.
* **Ongoing workloads by type** — The number of running notebook servers
(**Workspaces**) and training jobs (**Experiments**).
Clicking the cluster guides you to the **Overview** tab which holds more detailed information about the cluster.
### Cluster status overview
The **Cluster status overview** section presents the basic information about the cluster including the connection and incident status.
 The section contains the following information:
* **Total node**: Shows all nodes.
* **Available node**: Indicates the number of nodes you can use.
* **Failed node**: Displays the nodes that are in a failed status.
**"Failed node" detailed explanation and actions**
A "Failed node" refers to a node where the network communication between the
Kubernetes Control Plane and the
[kubelet](https://kubernetes.io/docs/reference/command-line-tools-reference/kubelet/)
is disrupted, leaving its status unknown. Since communication errors can
occur due to various reasons, identifying the root cause requires direct
inspection of the node.
**Steps to take:**
1. The cluster administrator should inspect the node by checking the kubelet
logs, the node's status, and network connectivity. The debugging feature
is included in the **Logs** page.
2. If the issue persists and no actionable solution can be determined,
please contact us at [support@vessl.ai](mailto:support@vessl.ai) or through
the chat button on VESSL, located at the bottom-right corner. Our
engineering team will assist you promptly.
If you need the information about communication between nodes and the control
plane, please refer to [Kubernetes' official
documentation](https://kubernetes.io/docs/concepts/architecture/control-plane-node-communication/).
### Quotas and usage
**Quotas & Usage** shows the organization-wide and personal resource quota for the cluster, including the number of GPU hours and occupiable GPUs and CPUs. This is set by the organization admin. Refer to our next section in the documentation **VESSL Cluster's features** on cluster administration.
The section contains the following information:
* **Total node**: Shows all nodes.
* **Available node**: Indicates the number of nodes you can use.
* **Failed node**: Displays the nodes that are in a failed status.
**"Failed node" detailed explanation and actions**
A "Failed node" refers to a node where the network communication between the
Kubernetes Control Plane and the
[kubelet](https://kubernetes.io/docs/reference/command-line-tools-reference/kubelet/)
is disrupted, leaving its status unknown. Since communication errors can
occur due to various reasons, identifying the root cause requires direct
inspection of the node.
**Steps to take:**
1. The cluster administrator should inspect the node by checking the kubelet
logs, the node's status, and network connectivity. The debugging feature
is included in the **Logs** page.
2. If the issue persists and no actionable solution can be determined,
please contact us at [support@vessl.ai](mailto:support@vessl.ai) or through
the chat button on VESSL, located at the bottom-right corner. Our
engineering team will assist you promptly.
If you need the information about communication between nodes and the control
plane, please refer to [Kubernetes' official
documentation](https://kubernetes.io/docs/concepts/architecture/control-plane-node-communication/).
### Quotas and usage
**Quotas & Usage** shows the organization-wide and personal resource quota for the cluster, including the number of GPU hours and occupiable GPUs and CPUs. This is set by the organization admin. Refer to our next section in the documentation **VESSL Cluster's features** on cluster administration.
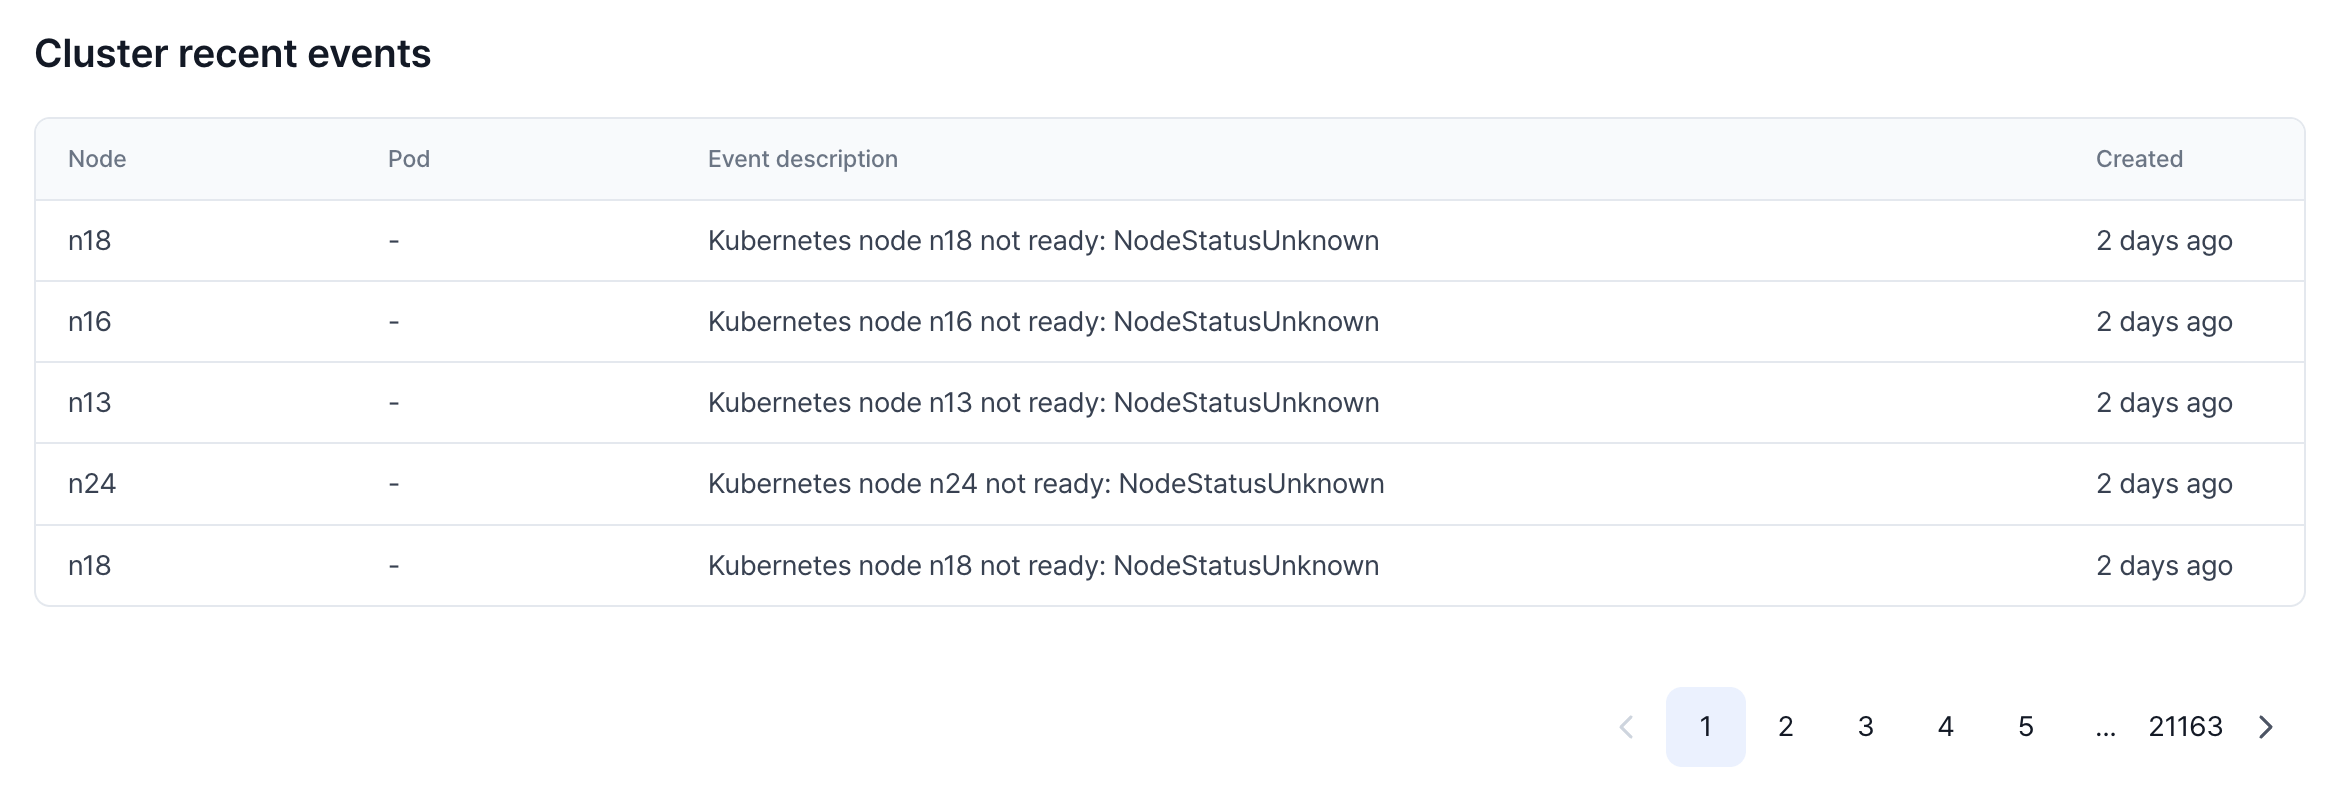
 ### Cluster recent events
 ### System metrics
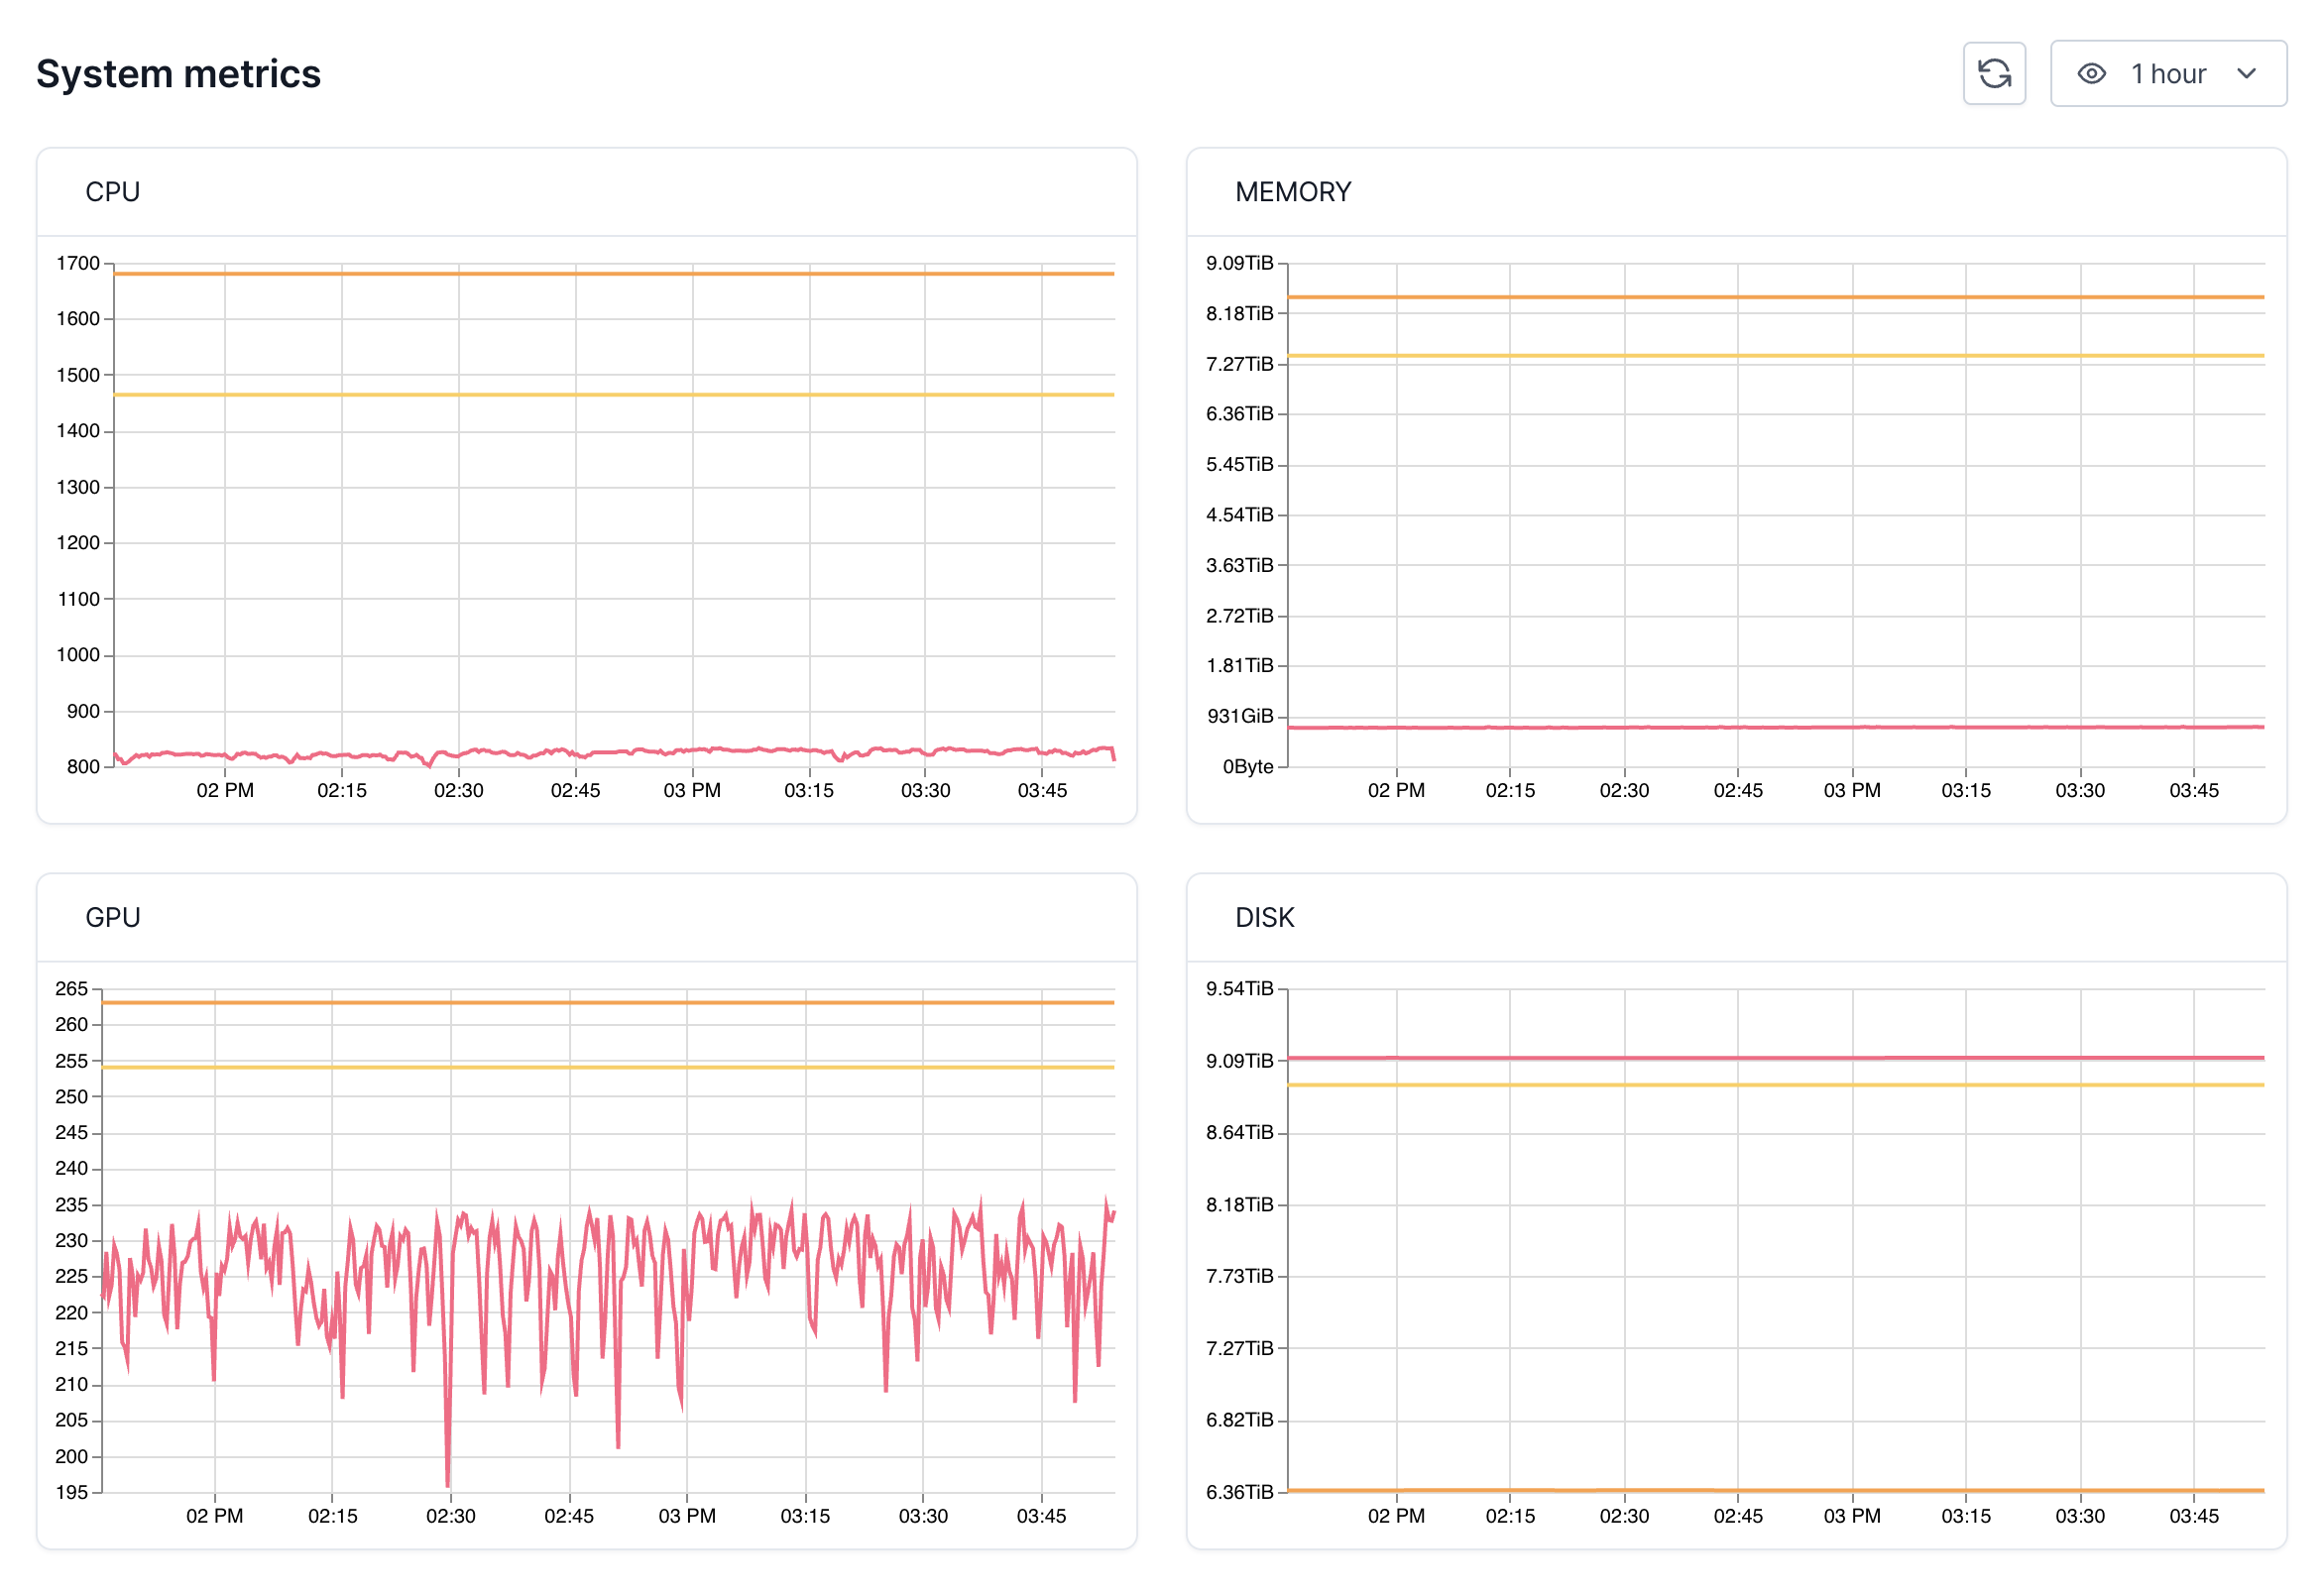
This section shows you how much CPU, GPU, and memory have been requested (and allocated) and are currently being used.
Note that when you are using **VESSL Workspace** (notebook servers) you may be
occupying a node without actively using the resources — you are only actively
using the resources only when the cell is running.
### System metrics
This section shows you how much CPU, GPU, and memory have been requested (and allocated) and are currently being used.
Note that when you are using **VESSL Workspace** (notebook servers) you may be
occupying a node without actively using the resources — you are only actively
using the resources only when the cell is running.
 ### Recent workloads
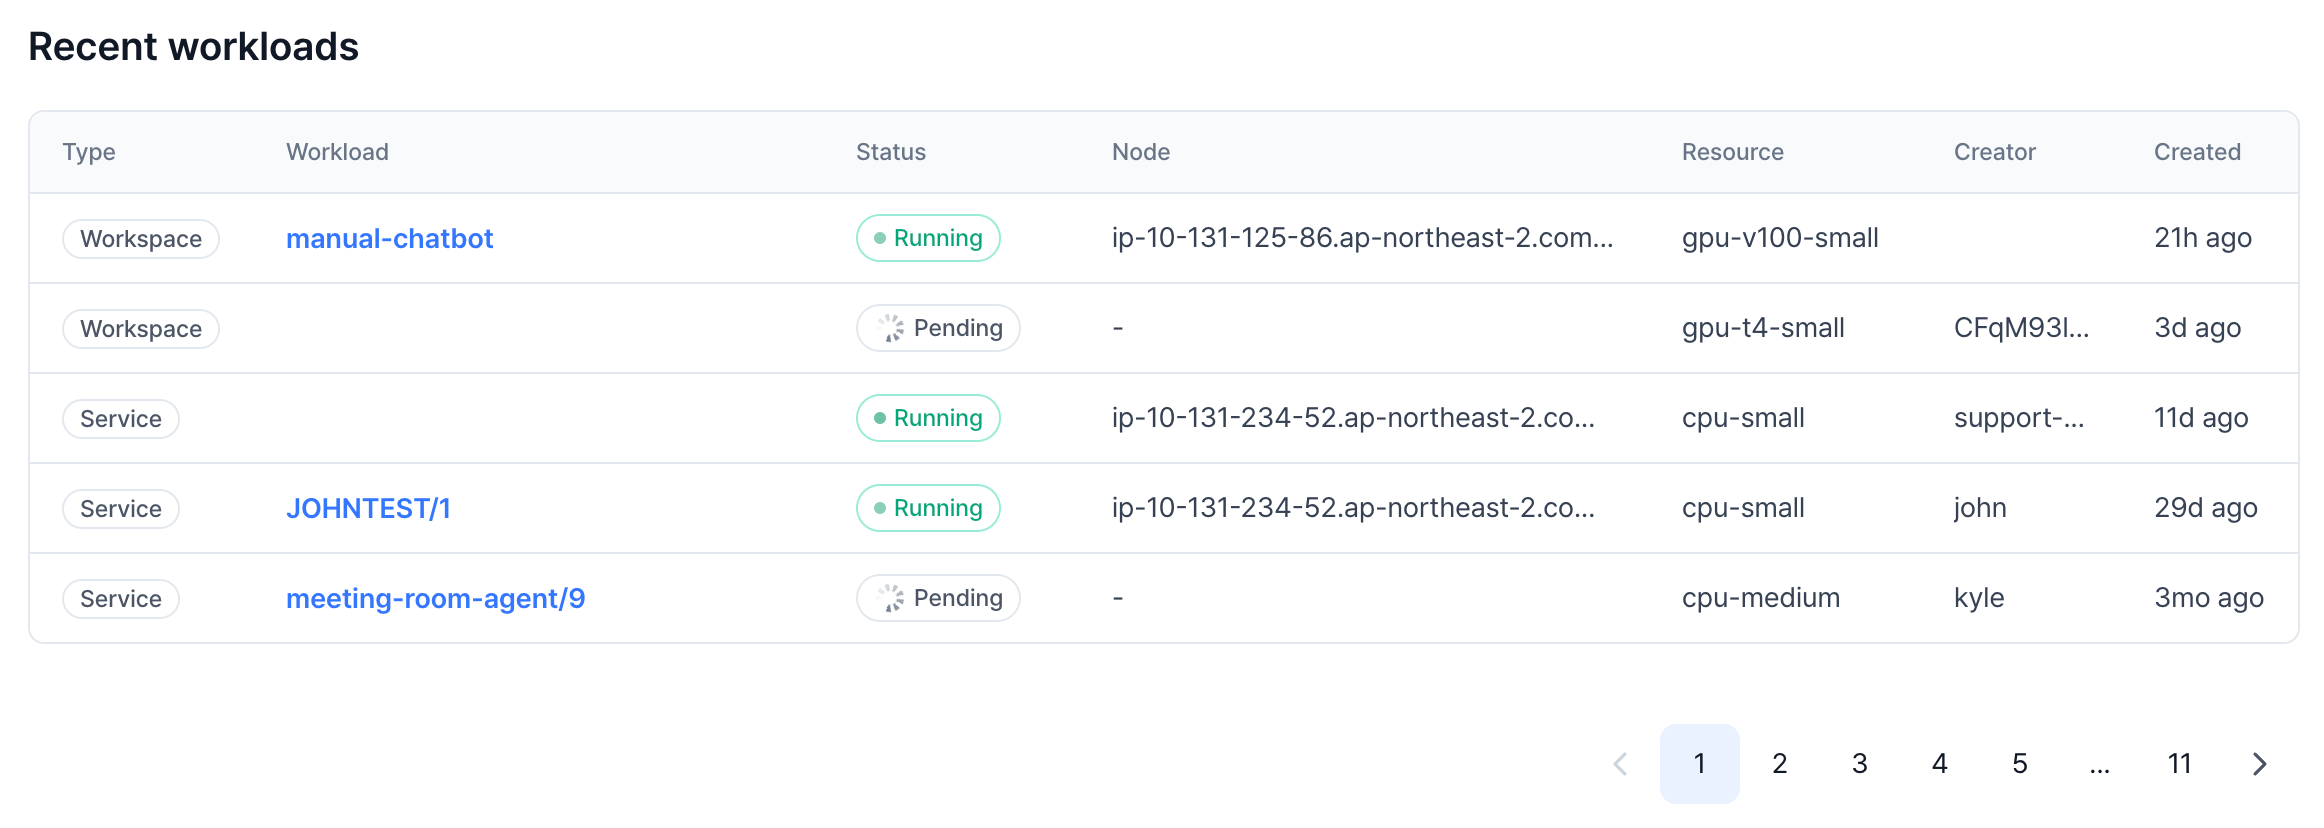
This section shows all ongoing workloads on the cluster with information on the type, status, occupying node, resource, creator, and the created date.
### Recent workloads
This section shows all ongoing workloads on the cluster with information on the type, status, occupying node, resource, creator, and the created date.
 ## Node-level monitoring
Under **Nodes**, you can view all the worker nodes tied to the cluster with their name, status, real-time CPU, memory, disk and GPU usage, ongoing workloads by their type, and overall health status (**Healthy**).
## Node-level monitoring
Under **Nodes**, you can view all the worker nodes tied to the cluster with their name, status, real-time CPU, memory, disk and GPU usage, ongoing workloads by their type, and overall health status (**Healthy**).
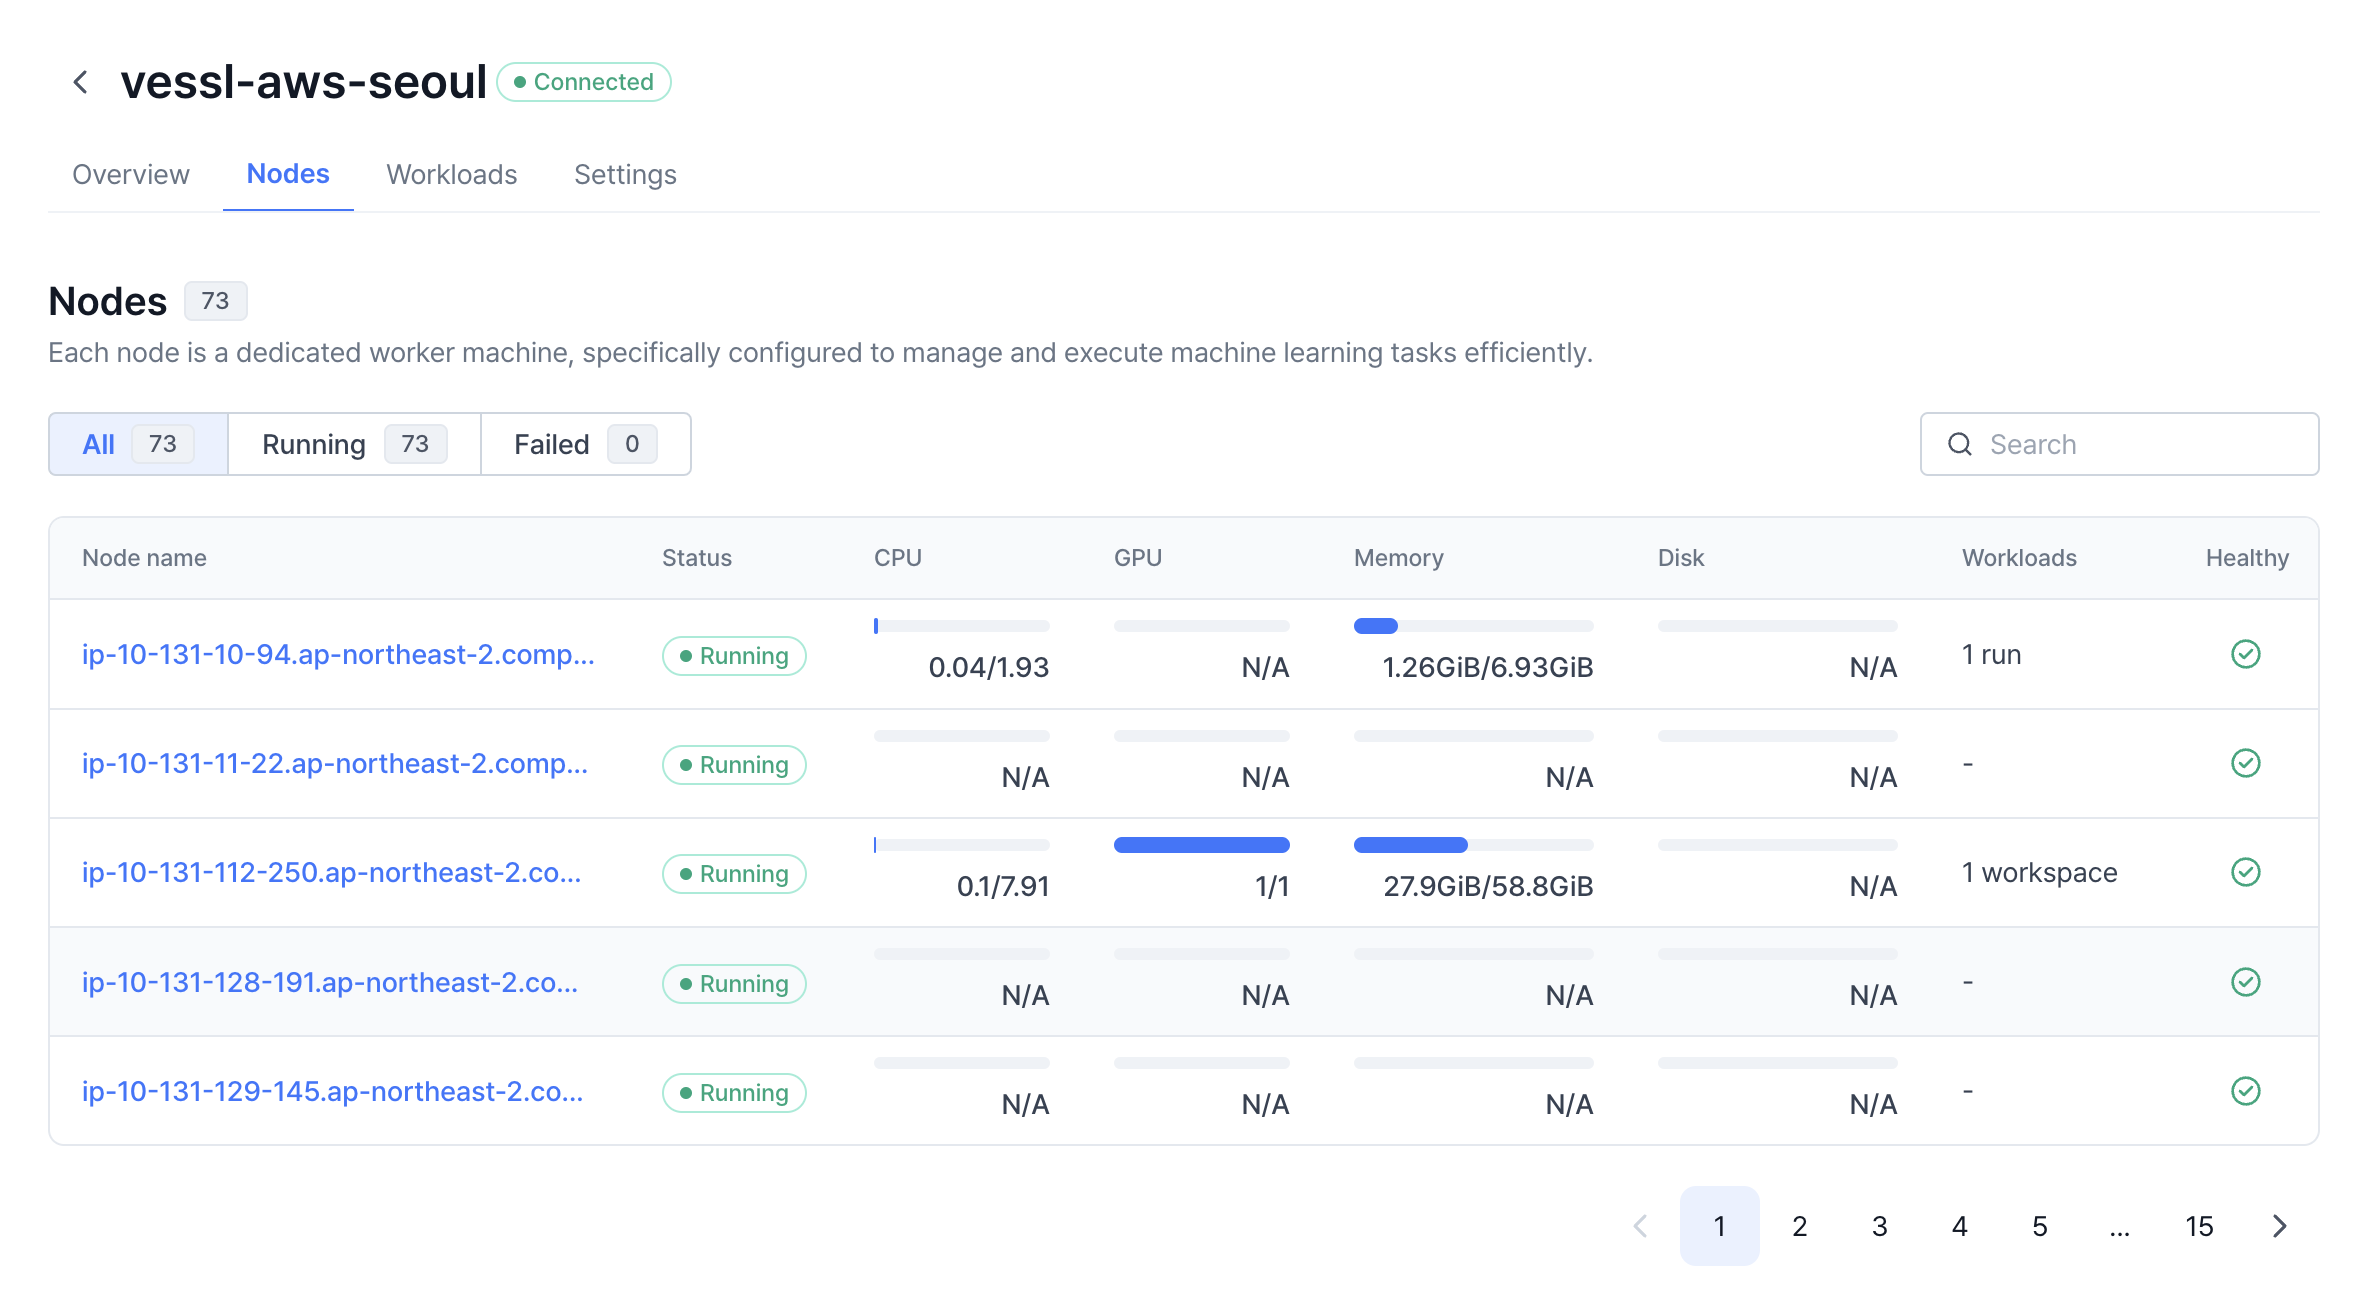 By clicking the each node name, you can get more in-depth information.
Take a quick tour of the in-depth page for the each node with the demo below.
By clicking the each node name, you can get more in-depth information.
Take a quick tour of the in-depth page for the each node with the demo below.
## Workload-level monitoring
Under **Workloads**, you can view the workload log related to the cluster with the current status, occupying node, resource consumption, and a visualization of the usage history. If you are an organization admin, clicking the workload name guides you to the detailed workload page under **Project** or **Workspace**.
Take a quick tour of the workload-level monitoring with the demo below.
If you are on the **Enterprise plan** and wish to send the cluster information
collected by **VESSL Cluster Agent** to your central infra monitoring tool such
as Datadog and Grafana, contact us at
[support@vessl.ai](https://vessl.ai/talk-to-sales).